Intent: demonstrate — this guide walks school IT coordinators and network administrators through establishing a school recognition display TCP zero window baseline to tell receiver-side resource pressure apart from packet loss when a hall-of-fame kiosk, athletic record board, or donor wall screen stalls, buffers slowly, or drops frames while loading interactive media.
A TCP zero-window condition occurs when the receiving device — the recognition display media PC — advertises a receive window size of zero, signaling the sender (the cloud CMS server) to pause transmission until the receiver has drained its buffer and can accept more data. From the hallway, a zero-window stall is indistinguishable from a stall caused by packet loss: the screen pauses, the loading indicator spins, and the content does not advance. But the root cause is entirely different. Packet loss points to the network path — a congested switch port, a flapping wireless link, or a misconfigured QoS policy. A zero-window event points to the receiving device itself — insufficient available RAM, a CPU bottleneck consuming cycles that should be draining the network buffer, or slow disk I/O during simultaneous content writes. Without a baseline capture taken during healthy operation, IT staff have no reference point to determine whether zero-window events observed during a stall are abnormal, how frequently they occur under normal load, and whether the cause is the network or the display hardware.
The quick answer: run a Wireshark or tcpdump capture on the recognition display’s media PC for fifteen to thirty minutes during normal, healthy operation — no active content stalls, current CMS sync, no background system tasks — and record the count of [TCP ZeroWindow] packets. This is the zero-window baseline. When the display stalls, run a second capture and compare. Zero-window events significantly above the baseline, with no simultaneous TCP retransmissions or duplicate ACKs, indicate receiver-side resource pressure rather than packet loss. Zero-window events at or near baseline combined with retransmissions indicate a network path problem. The distinction determines whether IT staff should investigate the display PC’s CPU, RAM, and I/O resources, or investigate the switch port, VLAN, and upstream link.
This procedure applies to recognition displays running Windows 10/11 or Linux on dedicated media PCs. It is most useful when the display has experienced unexplained slow loading, video buffering, or stalled athlete profile transitions that network-side monitoring has not explained through packet loss metrics alone.
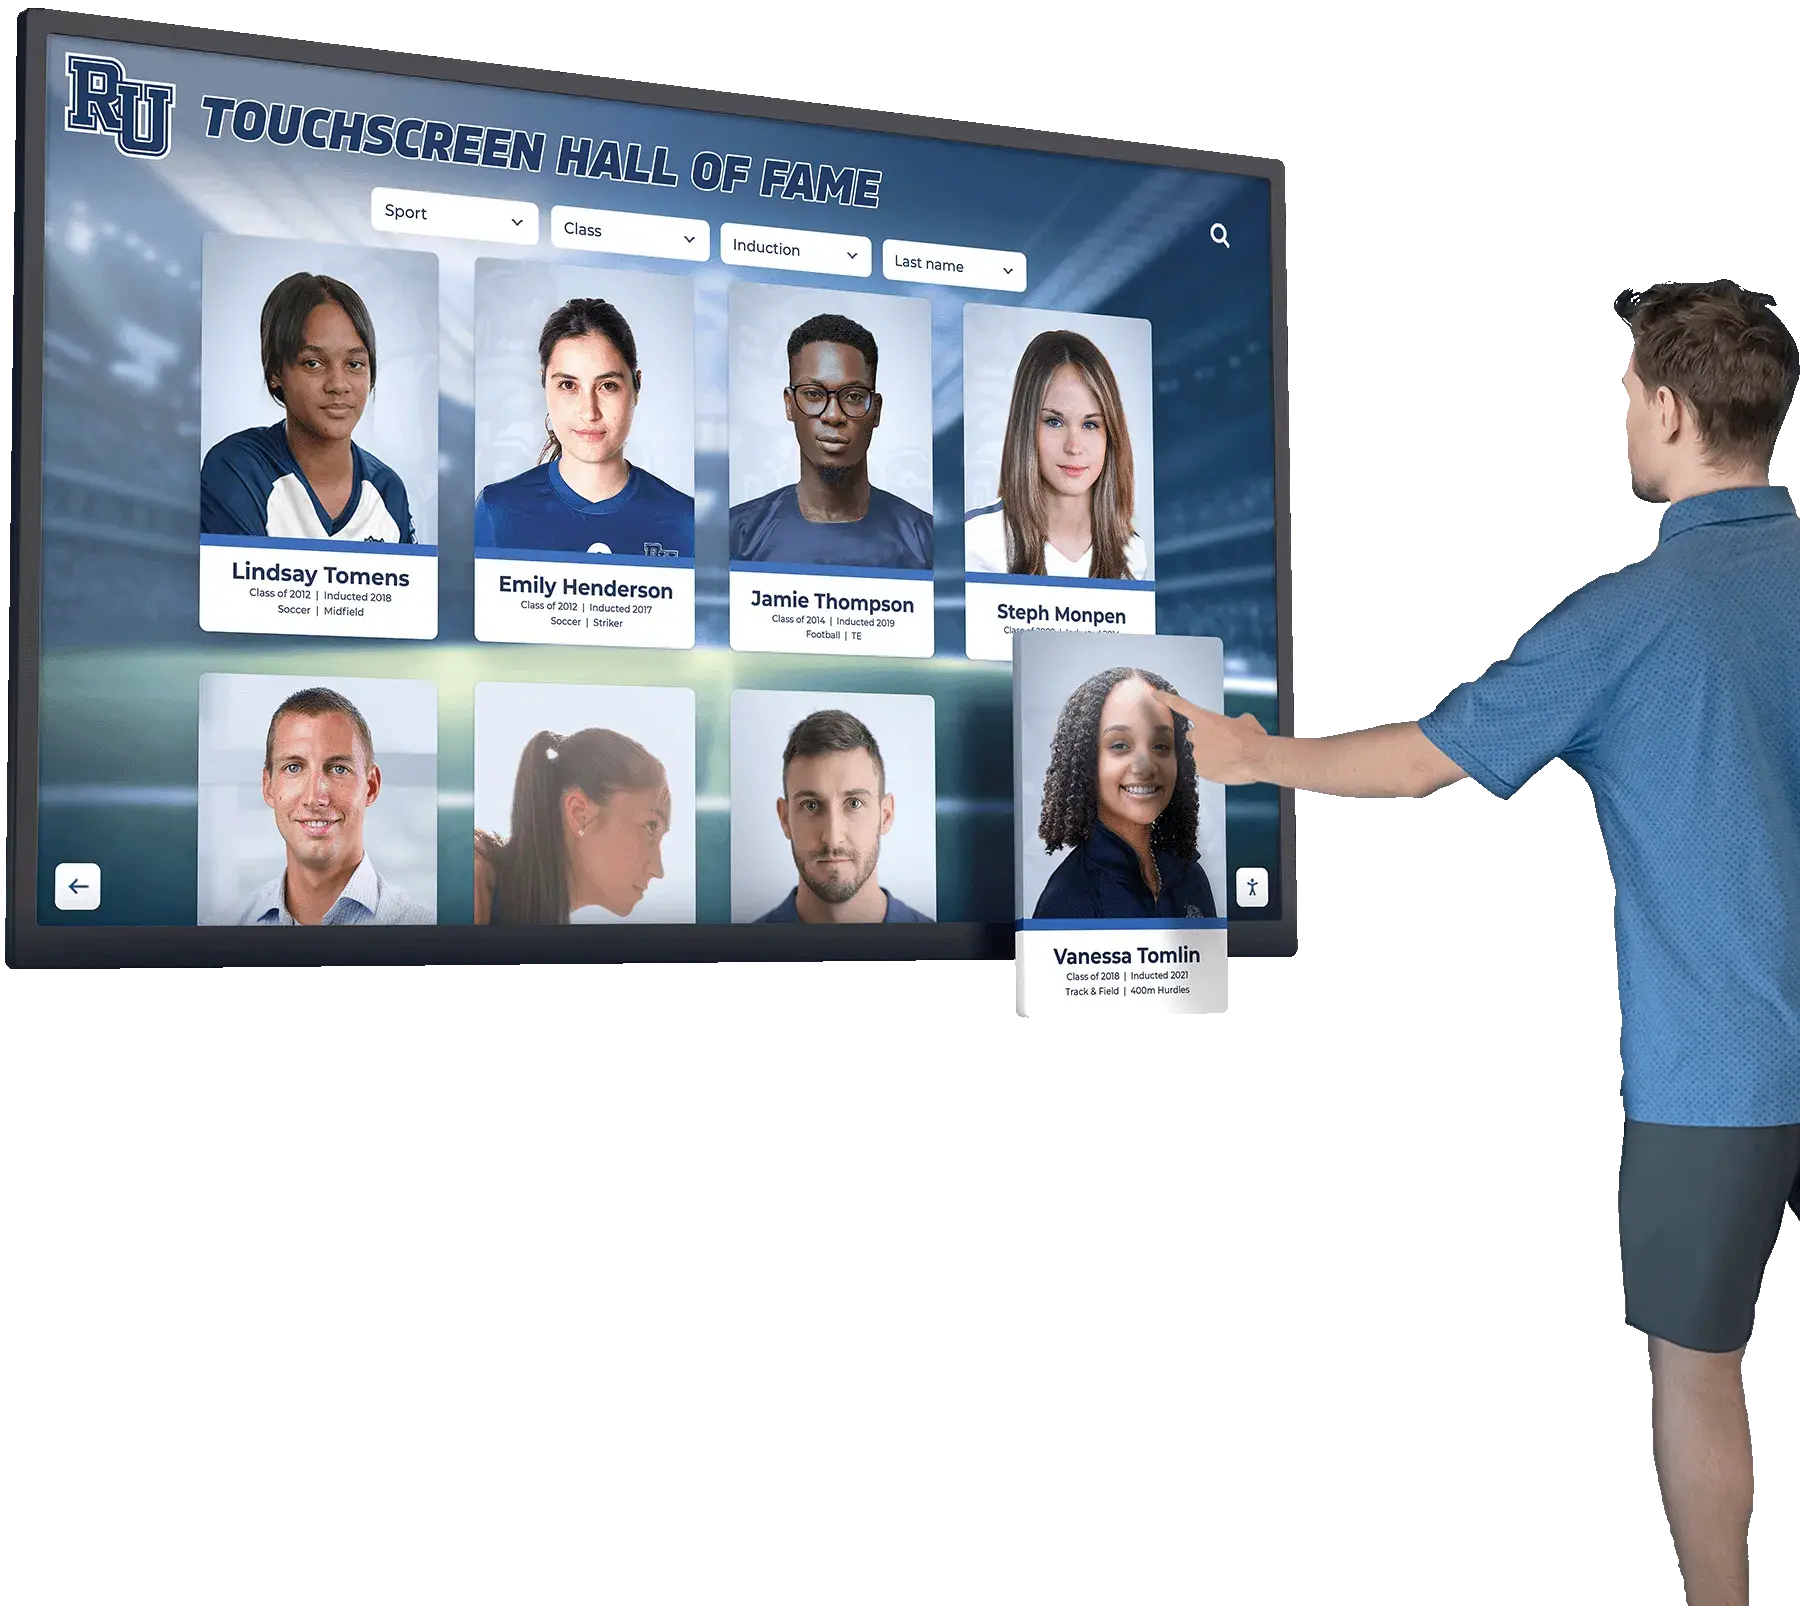
A hall-of-fame kiosk stalling during athlete profile loads or video transitions can be caused by network packet loss or by the display PC exhausting its receive buffer — a baseline capture taken during healthy operation gives IT staff the reference point to tell these causes apart
What Is a TCP Zero-Window Condition?
TCP zero window is a flow control mechanism built into the Transmission Control Protocol (TCP). Every TCP connection involves a receive window — a value the receiving host advertises in each TCP segment header to tell the sender how many bytes of data the receiver’s buffer can accept without being overwhelmed. When the receiver’s buffer is full and it cannot accept additional data, it sets the advertised window size to zero. The sender must stop transmitting new data immediately upon receiving a segment with a zero window and wait for a window update from the receiver before resuming.
The sequence of events during a zero-window stall on a recognition display is:
- The display’s media PC is receiving content data from the CMS server — athlete images, video segments, award record updates — faster than the OS can pass the data from the network buffer to the consuming application.
- The OS network buffer fills completely. The OS sets the receive window to zero in the next TCP ACK sent to the CMS server.
- The CMS server receives the zero-window ACK and pauses transmission.
- The display’s OS processes buffered data and drains some buffer space.
- The OS sends a window update to the CMS server announcing that buffer space is available again.
- The CMS server resumes sending.
If buffer drain is slow — because the CPU is busy, the disk is slow, or available RAM is low — the zero-window condition persists and data delivery stalls for seconds or longer.
TCP zero-window probes are a related mechanism: after the sender pauses for a zero-window timeout period (typically one to two seconds), it sends a single-byte probe to check whether the receiver’s window has opened. In Wireshark and tcpdump, these probes appear as [TCP ZeroWindowProbe] and the corresponding acknowledgments as [TCP ZeroWindowProbeAck].
TCP Zero Window vs. Packet Loss: The Diagnostic Distinction
Zero-window events and packet loss both produce stalls, but their packet capture signatures differ completely.
Zero-window events in a capture:
[TCP ZeroWindow]— segments from the display to the CMS server with a window size of 0[TCP ZeroWindowProbe]— single-byte probes from the CMS server to the display during the pause[TCP ZeroWindowProbeAck]— display acknowledging the probe (window may still be zero)- No retransmissions of lost data; all sent data was received, just not yet processed
Packet loss events in a capture:
[TCP Retransmission]— CMS server re-sending data that was not acknowledged within the retransmission timeout[TCP Fast Retransmission]— re-send triggered by three duplicate ACKs[TCP Duplicate ACK]— display repeatedly ACKing the last successfully received byte, signaling a gap in the sequence number space- Window size may remain normal (receiver has buffer space, but the data is not arriving due to loss in the network)
The presence of zero-window events with no retransmissions means data arrived at the display but the display could not process it quickly enough. The presence of retransmissions and duplicate ACKs with normal window sizes means data is being lost or delayed between the CMS server and the display. A mixture of both patterns can occur when a resource-constrained display PC also experiences network congestion — in that case, the capture distinguishes which condition is dominant. Schools that maintain interactive athletic hall-of-fame displays with high-resolution athlete photos and video content are most likely to encounter zero-window events, since large media payloads stress both the network delivery path and the receiver’s processing capacity.
Why TCP Zero-Window Baselines Matter for School Recognition Displays
Recognition displays are unattended devices running in public hallways and lobbies. When a display stalls loading content, the first assumption is usually a network problem — and IT staff reach for switch logs, link utilization metrics, and ping tests. But a recognition display with receiver-side resource pressure produces a stall that looks identical from the network side: throughput to the display drops, content loads slowly, and the display may eventually reconnect with fresh content once its local buffer pressure eases.
Without a baseline, no comparison is possible. Some zero-window events are normal. When a display’s CMS application first loads a large athlete photo collection or a video introduction sequence, the media PC’s buffer may fill briefly even on a healthy, well-resourced system. A single zero-window event of 500 milliseconds during a heavy content load is unremarkable. Thirty zero-window events per minute during ordinary operation indicates a resource constraint. Without a baseline capture taken during a known-good period, IT staff cannot determine which situation they are looking at when a stall is reported.
School display PCs accumulate background load over time. A media PC installed in a school lobby runs continuously during the school year and may not be rebooted for months. Over time, background processes accumulate — CMS auto-updaters, OS update agents, antivirus scans, log rotation processes — that compete with the CMS application for CPU cycles and RAM. A display that ran with zero zero-window events at commissioning may show frequent zero-window events six months later as background load increases. Establishing a baseline at commissioning and re-measuring periodically gives IT staff a trend line to detect resource creep before it causes user-visible stalls.
Interactive media imposes higher receiver load than static content. A recognition display showing a scrolling text ticker or a simple slide deck has modest receiver processing requirements. A digital hall-of-fame display showing high-resolution athlete portraits, multi-year championship banners, and video highlight clips from athletic events loads large payloads into the receive buffer in bursts. If the media PC does not have sufficient RAM to maintain a deep network buffer while simultaneously writing media assets to local storage and rendering them on screen, zero-window events will accompany every content load cycle — not just during anomalous conditions.
Network logs alone cannot reveal receiver-side pressure. A school’s managed switch may show zero packet errors and low link utilization on the display’s access port even while the display is stalling due to zero-window conditions. The switch sees a reduction in throughput to the display, but attributes it to the CMS server reducing its send rate — which is exactly what the CMS server is doing in response to the zero-window signals. The network looks healthy by every switch metric. Only a packet capture on the display itself — or on a port mirror of the display’s access port — reveals the zero-window events at the application layer. Schools that maintain comprehensive school recognition archives and time-sensitive awards content depend on the display staying responsive; identifying zero-window pressure early prevents a slow resource creep from becoming a visible stall at a high-profile event.
Summer hardware changes can introduce zero-window pressure. Schools that replace display media PCs over the summer, upgrade to a new OS image, or add additional CMS content — more athlete profiles, longer video introductions, richer award category pages — may find that zero-window events appear or increase in frequency when the school year begins. If the new content load exceeds what the hardware can buffer at the CMS server’s send rate, zero-window pressure emerges. Running a baseline capture before the first day of school confirms the new hardware and content load are compatible. Schools that expand their athletic recognition program content over the summer should plan a re-baseline as part of summer commissioning.
TCP Zero-Window vs. Packet-Loss Decision Tree
Use this decision tree when a recognition display stall is reported, before running the full baseline capture checklist.
1. Is the display currently stalling or was the stall intermittent?
- Currently stalling → run a live capture immediately (Step 4 of the checklist) before proceeding
- Intermittent stall resolved on its own → proceed through the decision tree to determine root cause before the next event
↓
2. Are the switch port error counters for the display’s access port showing input errors, output errors, or CRC errors?
- YES → packet loss at the physical layer is likely; check cable, SFP, and duplex negotiation before running a capture; physical errors cause retransmissions, not zero-window events
- NO → proceed; physical layer appears clean
↓
3. Run a short packet capture (5 minutes) during the stall or immediately after. Filter for tcp.analysis.zero_window in Wireshark or tcp[13:1] == 0 in tcpdump. Are zero-window events present?
- YES, with no TCP retransmissions → receiver-side resource pressure; proceed to Step 5 of the checklist to investigate display PC CPU, RAM, and I/O
- YES, with TCP retransmissions also present → mixed condition; both network loss and receiver pressure; investigate network path first (switch port, VLAN, upstream link), then address receiver resources
- NO zero-window events, only retransmissions → packet loss on the network path; investigate switch, VLAN configuration, or upstream link; display PC resources are not the cause
- NO events of either type → capture may not have caught the stall window; stall may be at the application layer (CMS logic, content rendering), not TCP flow control; check CMS application logs
↓
4. If zero-window events are confirmed, compare the count to the baseline (established in the checklist below).
- Count significantly above baseline → resource pressure has worsened since baseline; check for new background processes, OS updates, antivirus scans, or RAM reduction
- Count at or near baseline → zero-window frequency is normal for this display and content set; stall may be coincidental with a momentarily large content payload; monitor over the next load cycle
- No baseline exists → run the baseline capture procedure (Steps 1–3 of the checklist) immediately to establish a reference point
↓
5. Is the zero-window pressure correlated with a specific content event?
- YES, stall coincides with video playback or large photo gallery load → receiver buffer pressure is content-load-specific; consider reducing video bitrate or increasing RAM on the display PC
- YES, stall coincides with a background OS or CMS update running concurrently → background process is competing for RAM and CPU; schedule updates during off-hours
- NO correlation → persistent low-level zero-window pressure; display PC is chronically resource-constrained; hardware upgrade or content optimization needed
↓
6. Result: Zero-window baseline comparison gives a data-backed answer to whether the stall is network-sourced or device-sourced — and the decision tree above gets IT staff to the right investigation path in under ten minutes.
Tools Required
| Tool | Use | Notes |
|---|---|---|
| Wireshark (display media PC or dedicated capture laptop) | Capture TCP traffic to and from the CMS server; apply tcp.analysis.zero_window display filter to isolate zero-window events; count events per unit time for baseline and stall comparison | Free and open-source; runs on Windows and Linux; install directly on the display media PC for the most direct capture, or use a laptop connected to a port mirror on the access switch; the tcp.analysis filter group is the most efficient way to isolate zero-window, probe, and retransmission events without parsing raw sequence numbers |
tcpdump (Linux display OS) | Lightweight command-line capture tool for Linux display PCs where Wireshark is not installed; saves a pcap file for later analysis in Wireshark on a separate workstation | Available in most Linux distributions via apt install tcpdump; use sudo tcpdump -i eth0 -n host <CMS-server-IP> -w /tmp/baseline.pcap to capture traffic to and from the CMS server and save for analysis; requires root or sudo privileges |
Task Manager or htop | Monitor CPU utilization, RAM consumption, and disk I/O on the display media PC during baseline capture and during stall events; correlate resource spikes with zero-window events in the packet capture timeline | Windows: Task Manager (Ctrl+Shift+Esc) → Performance tab; Linux: htop or iostat -x 1 for disk I/O; the goal is to confirm whether zero-window events coincide with CPU spikes, RAM pressure (high swap usage), or disk I/O saturation — each points to a different remediation |
| Managed switch CLI or web console | Read input/output error counters on the display's access port; rule out physical-layer packet loss before interpreting zero-window events; optionally configure a port mirror to allow a separate capture laptop to observe the display's traffic without installing Wireshark on the display PC itself | Error counters are available via show interface <port> on Cisco IOS-style platforms; access switches from Ubiquiti, Meraki, and most school-grade platforms expose port statistics in the web UI; check CRC errors and input errors specifically — these are the packet loss indicators most likely to co-occur with zero-window events in a mixed-cause stall |
| CMS management portal | Confirm the display's last content synchronization timestamp before and after the baseline capture; verify the display is reaching the CMS and syncing content normally, confirming the capture represents a genuinely healthy baseline rather than a partially degraded state | The CMS portal is the application-layer health indicator; a display that appears healthy by TCP metrics but has a stale sync timestamp may have an application-layer problem, not a network or resource problem; both conditions must look healthy for the capture to represent a true baseline |
| Spreadsheet or commissioning record document | Record the baseline zero-window event count, capture duration, CMS server IP, display OS type, RAM installed, and CPU utilization during capture; store the pcap file path for future reference | The baseline is only useful if it is documented and accessible to future IT staff; a capture run once and never recorded is lost when the IT coordinator who ran it leaves the district; the commissioning document is the durable reference |
Pre-Test: Confirm the Display Is in a Healthy State Before Baselining
A zero-window baseline taken during a degraded or partially stalled state is not a useful reference — it would capture elevated zero-window events as the “normal” baseline, causing future comparisons to miss genuine resource pressure events. Before running the baseline capture, confirm all of the following.
Confirm the CMS portal shows the display online with a current sync timestamp. Log into the CMS management portal and verify the display’s status is online and the last content synchronization is within the expected interval. A display whose CMS connection has been idle for more than two sync cycles may not represent normal operating load.
Confirm no OS or CMS updates are running on the display PC. On Windows, check for active Windows Update downloads in Settings → Windows Update. On Linux, check for running package manager processes:
ps aux | grep -E 'apt|dpkg|yum|dnf'. Background update activity is the most common source of elevated zero-window events that would pollute a baseline. Schedule the baseline capture at a time when no updates are in progress.Confirm antivirus or endpoint protection is not in the middle of a scheduled scan. Scheduled scans consume disk I/O and CPU that directly compete with the CMS application’s ability to drain the network receive buffer. On Windows, open Windows Security → Virus & threat protection and confirm no scan is in progress. On Linux, check for active scan processes from the installed endpoint protection agent.
Confirm the display’s content is actively cycling — not frozen or in sleep mode. The baseline should represent the display in its normal interactive state: showing content, responding to touch if applicable, and syncing with the CMS on its normal schedule. A display in sleep mode with no CMS activity will show very few zero-window events — correct for that state, but not representative of the operating conditions where stalls occur.
Record the CMS server IP address. The packet capture will be filtered to traffic between the display and the CMS server. Confirm the IP address the display is currently using to reach the CMS: on Windows,
netstat -n | findstr :443and look for established connections to the CMS server’s IP range; on Linux,ss -tn | grep ESTABand look for CMS server connections. Record the CMS server IP.Record the display PC’s current RAM utilization and available RAM. Run
free -hon Linux or check Task Manager → Performance → Memory on Windows. Record free RAM and total RAM. A display with less than 20% free RAM before the baseline capture begins is already under resource pressure and may produce an artificially elevated baseline; note this for interpretation.
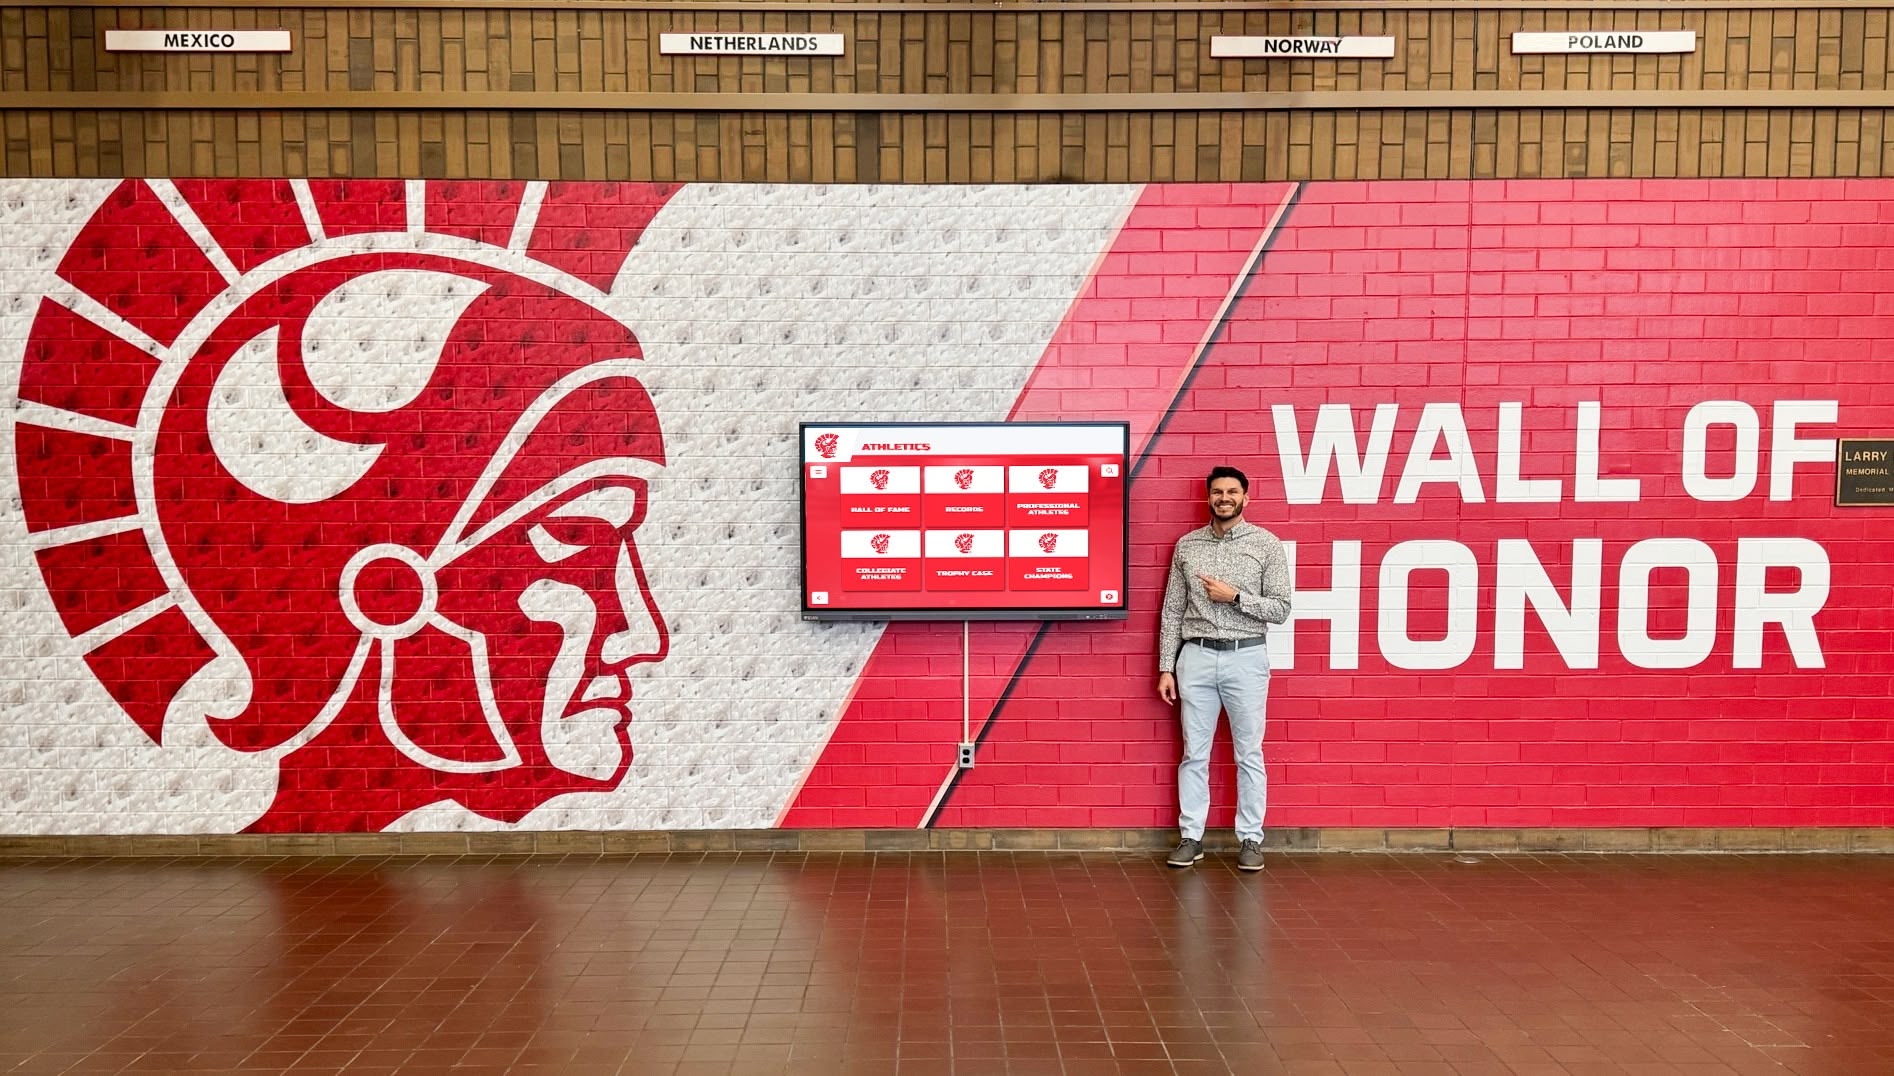
Confirming the display is in a healthy, fully synchronized state — with no active OS updates, antivirus scans, or background processes competing for resources — before beginning the baseline capture ensures the zero-window event count captured reflects normal operation, not a pre-existing resource constraint
School Recognition Display TCP Zero-Window Baseline Checklist
Step 1: Run the Baseline Packet Capture
Capture fifteen to thirty minutes of normal operation with no user-reported stalls and no known background system activity.
On a Windows display PC (Wireshark):
- Open Wireshark as administrator. Select the active Ethernet interface.
- In the capture filter bar (at the top of the interface list, before starting capture), enter:
host <CMS-server-IP>to limit the capture to traffic between the display and the CMS server. This reduces capture file size and speeds analysis. - Click Start. Run the capture for fifteen to thirty minutes during normal display operation — content cycling, CMS sync occurring, no user-reported issues.
- Click Stop. Save the capture file: File → Save As →
baseline-<date>-<display-location>.pcap.
On a Linux display PC (tcpdump):
sudo tcpdump -i eth0 -n host <CMS-server-IP> -w /tmp/baseline-$(date +%Y%m%d).pcap
Run for fifteen to thirty minutes, then press Ctrl+C to stop. Transfer the pcap file to a workstation with Wireshark for analysis.
Pass criteria: Capture file saved; duration fifteen to thirty minutes; no user-reported stalls during capture window; CMS portal confirmed online with current sync timestamp at start and end of capture.
Step 2: Analyze the Baseline Capture for Zero-Window Events
Open the baseline capture in Wireshark and count the zero-window events.
- Open the saved pcap file in Wireshark.
- In the display filter bar, enter:
tcp.analysis.zero_windowand press Enter. Wireshark shows only the packets flagged as zero-window conditions — segments sent from the display to the CMS server with a window size of 0. - Count the total number of zero-window packets displayed. Note the timestamps of the first and last packet to confirm the visible events span the full capture duration.
- Calculate the zero-window event rate: total events ÷ capture duration in minutes = zero-window events per minute.
- Now apply a second filter:
tcp.analysis.retransmission— count any TCP retransmission events. If retransmissions are present in the baseline capture (more than one or two, which can occur from transient conditions), note whether they coincide in time with the zero-window events. Simultaneous zero-window and retransmission events in a baseline capture indicate the display was not in a fully healthy state; consider re-running the baseline after addressing background load. - Also check:
tcp.analysis.zero_window_probe— count probe packets. The number of probes should be proportional to the number of zero-window events (one or more probes per zero-window condition). Very high probe counts relative to zero-window events may indicate extended zero-window conditions during the capture window.
Record: zero-window events total, zero-window events per minute, retransmission events total, and capture duration.
Pass criteria: Zero-window event rate calculated and recorded; retransmission count documented; if retransmissions exceed 5 during the baseline window, re-run the baseline after confirming the display is in a healthy state.
Step 3: Record the Baseline Metrics and System State
Document the baseline measurements alongside the system state at the time of capture.
- Record the zero-window event rate (events per minute) from Step 2. This is the baseline rate that future comparisons will reference.
- Record from Task Manager (Windows) or
htop/free(Linux): CPU average utilization during capture, RAM free and total, and disk I/O activity (particularly write activity, which reflects CMS content caching to local storage). - Record the CMS server IP address used in the capture filter.
- Record the display OS version, RAM installed, and media PC model.
- Record the date, time of day, and display location. Time of day matters — a capture run during morning content load (when the CMS pushes overnight updates to the display) may show more zero-window activity than a capture run during an afternoon steady-state period. Document when the capture was taken so future baselines are compared against captures from comparable time windows.
- Save the pcap file in a location accessible to future IT staff, and document the file path in the commissioning record.
Pass criteria: All six items recorded; pcap file saved and path documented; baseline ready to use as a comparison reference.
Step 4: Run a Comparison Capture During a Stall Event
When the display stalls — or at the earliest opportunity after a stall is reported — run a capture during the stall to compare against the baseline.
During an active stall:
On Windows, open Wireshark as administrator and start a capture with the same host <CMS-server-IP> filter used during the baseline. On Linux:
sudo tcpdump -i eth0 -n host <CMS-server-IP> -w /tmp/stall-$(date +%Y%m%d-%H%M).pcap
Run the capture while the stall is occurring and for at least two minutes after the display appears to recover. Save as a stall capture file.
After the stall resolves, analyze the stall capture:
Apply the same Wireshark filters as Step 2: tcp.analysis.zero_window, tcp.analysis.retransmission, tcp.analysis.zero_window_probe. Calculate the zero-window event rate for the stall capture using the same events-per-minute formula.
Compare:
| Metric | Baseline | Stall Capture | Change |
|---|---|---|---|
| Zero-window events / min | (record) | (record) | (calculate) |
| Retransmission events total | (record) | (record) | (calculate) |
| ZeroWindowProbe count | (record) | (record) | (calculate) |
| CPU utilization (avg) | (record) | (record) | (calculate) |
| RAM free | (record) | (record) | (calculate) |
Interpretation:
- Zero-window rate significantly higher than baseline, retransmissions near zero → receiver-side resource pressure; investigate display PC CPU, RAM, and I/O
- Zero-window rate near baseline, retransmissions significantly higher → network path problem; investigate switch port, VLAN, and upstream link
- Both zero-window rate and retransmissions significantly higher → mixed condition; start with network path (retransmissions are actionable via switch and VLAN investigation), then address display PC resources
Pass criteria: Stall capture analyzed; zero-window rate compared to baseline; interpretation documented.
Step 5: Investigate Receiver-Side Causes If Zero-Window Events Exceed Baseline
If the stall capture confirms zero-window events significantly above baseline (more than twice the baseline rate as a working threshold), investigate the display PC’s resources.
CPU: Check Task Manager (Windows) or top / htop (Linux) during the stall for CPU utilization above 85% sustained. Identify which process is consuming CPU. Common culprits: CMS application rendering a large content payload, antivirus scan, OS update agent, or browser-based kiosk shell rendering complex HTML.
RAM: Check available free RAM during the stall. On Linux: free -h — look at the available column, not just free. On Windows: Task Manager → Performance → Memory → Available. A display with less than 200 MB available RAM during a stall is under genuine memory pressure. Increasing RAM is the most reliable long-term fix for zero-window events caused by buffer exhaustion.
Disk I/O: On Linux, run iostat -x 1 5 during the stall to check %util on the display’s storage device. On Windows, check Task Manager → Performance → Disk. Disk I/O above 80% during a stall indicates the OS is writing CMS content assets to local storage faster than the disk can handle, blocking buffer drain. An SSD or eMMC storage upgrade eliminates this bottleneck in most school display PC deployments.
Background processes: On Windows, use Task Manager → Details tab to sort by CPU and memory usage. Look for processes unrelated to the CMS application running during the stall window. On Linux, use ps aux --sort=-%cpu and ps aux --sort=-%mem. Schedule any discovered background processes (Windows Update, antivirus, CMS auto-updater) to run during off-hours — typically 2:00–4:00 AM for school recognition displays.
Schools that maintain athletic award tracking and records management on their recognition displays often add new award categories and expand photo archives at the start of each season, increasing the media payload size and the risk of zero-window pressure on display PCs with fixed RAM.
Pass criteria: Resource investigation completed; CPU, RAM, and disk I/O state during stall documented; background processes identified and scheduled for off-hours if causing stall-time resource pressure.
Need guidance on the network configuration and hardware specifications for a school recognition display that stays responsive through heavy media loads? Rocket Alumni Solutions provides school IT teams with complete hardware recommendations, CMS connection requirements, and on-site configuration support for hall-of-fame kiosks and athletic record boards. Schedule a network-readiness demo to see how their managed deployment approach addresses display PC resource planning before installation.
Step 6: Document Results and Store the Baseline
Record the full baseline and stall comparison before returning the display to unattended operation.
| Test Item | Expected Result | Actual Result | Pass / Fail | Tested By | Date |
|---|---|---|---|---|---|
| Display confirmed in healthy state before baseline capture | CMS portal online, sync current, no background updates or scans running | ||||
| Baseline capture run and saved | 15–30 minute capture file saved with CMS server IP filter; no user-reported stalls during capture window | ||||
| Baseline zero-window event rate calculated | Events-per-minute rate documented; retransmission count documented; both recorded in commissioning file | ||||
| Baseline system state recorded | CPU utilization, free RAM, disk I/O, OS version, RAM total, display location, and capture timestamp all documented | ||||
| Stall capture run and compared to baseline (if stall occurred) | Zero-window rate and retransmission counts compared; interpretation (network vs. receiver-side) documented | ||||
| Receiver-side resource investigation completed (if zero-window rate elevated) | CPU, RAM, and disk I/O causes identified; background processes rescheduled; hardware upgrade recommended if RAM below threshold | ||||
| pcap file and baseline metrics stored in commissioning record | File path documented; baseline metrics accessible to future IT staff without needing to re-run capture |
Go / No-Go rule: The baseline capture (Step 2) must be completed and the baseline zero-window event rate must be documented before any stall comparison is meaningful. A display whose zero-window baseline was never established cannot be diagnosed by comparison — IT staff are left with a capture that shows elevated events but no reference for what “elevated” means for that specific display and content load.
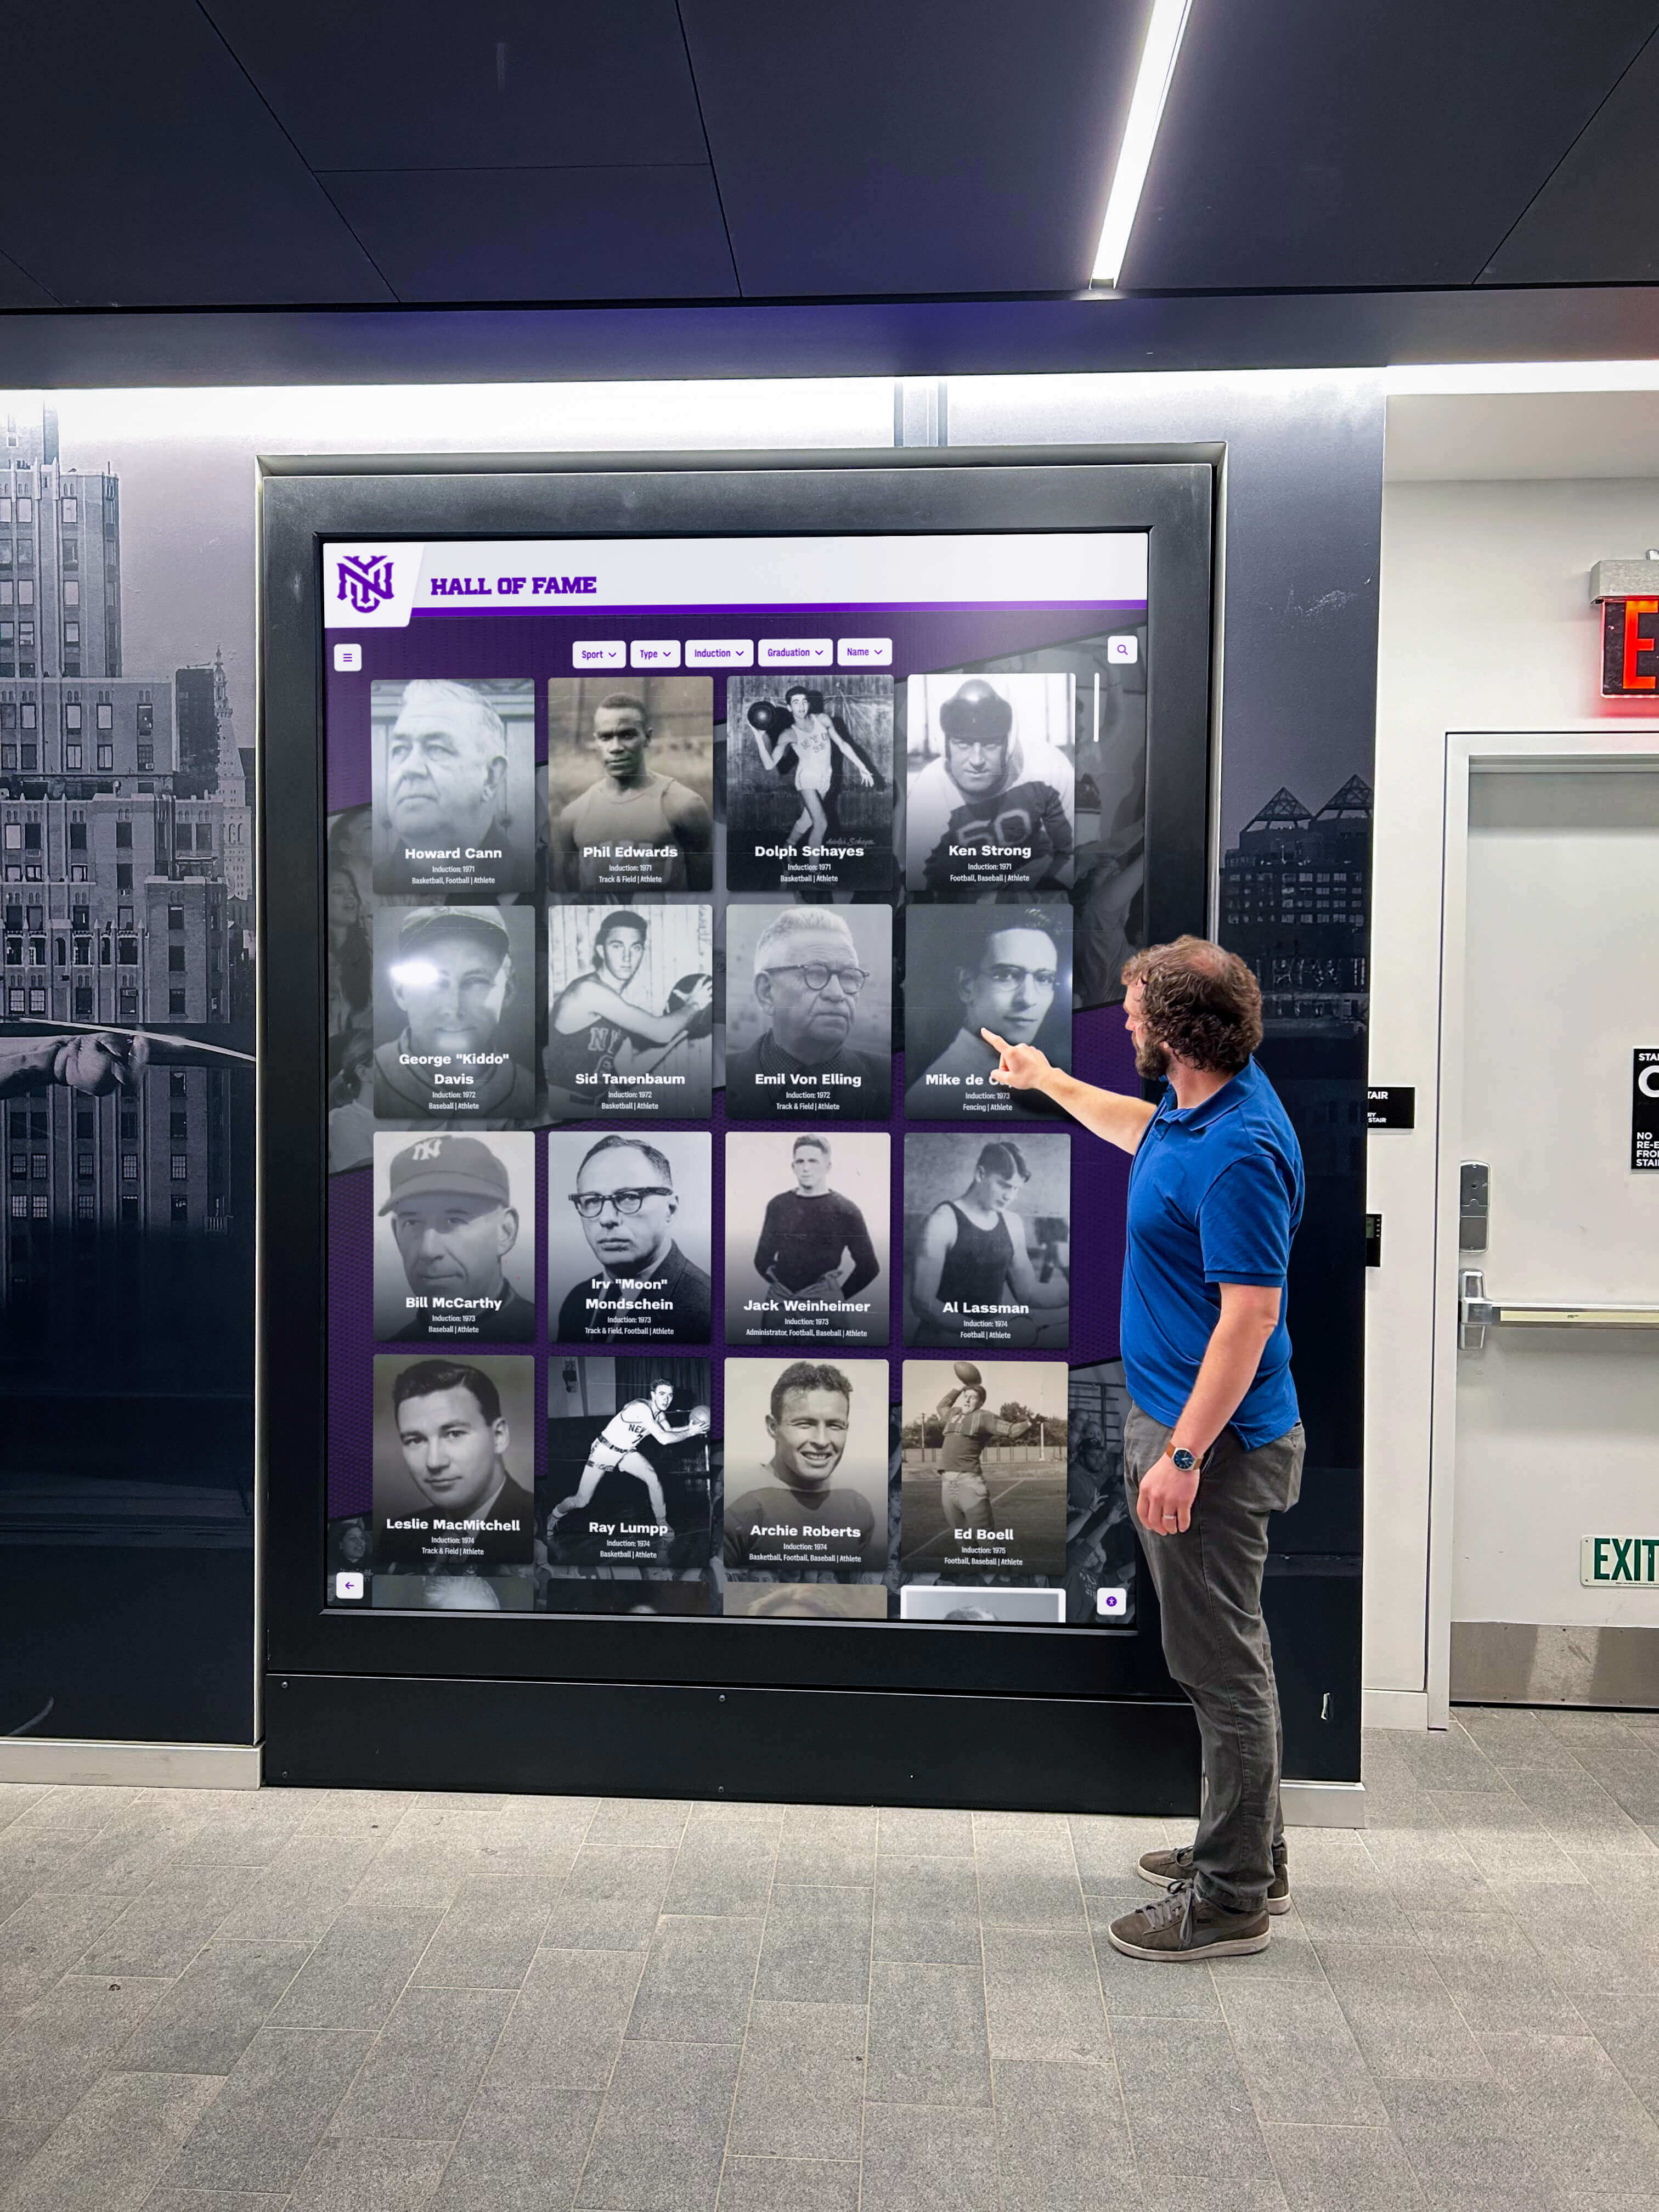
A completed zero-window baseline record, stored in the display's commissioning file, gives any IT staff member the reference point needed to interpret a stall-capture comparison without re-running the full baseline procedure
Cause-to-Action Table: TCP Zero-Window Patterns and Remediation
| Observed Pattern | Likely Root Cause | Recommended Action | Priority |
|---|---|---|---|
| Zero-window events well above baseline; no TCP retransmissions; CPU above 85% during stall | CPU bottleneck: a background process or the CMS rendering engine is consuming cycles needed to drain the receive buffer | Identify the high-CPU process with Task Manager or htop; reschedule background tasks to off-hours (2:00–4:00 AM); if the CMS renderer is the cause, contact the CMS vendor to check for a rendering optimization setting or a pending update | High — CPU bottlenecks cause stalls that recur on every affected content load cycle |
| Zero-window events well above baseline; no TCP retransmissions; free RAM below 200 MB during stall | RAM exhaustion: the display PC does not have enough free RAM to maintain the network receive buffer while running the CMS application and OS concurrently | Increase display PC RAM — 8 GB is the recommended minimum for a display running a full-featured CMS application with high-resolution media; 4 GB is often insufficient for displays with video content; check whether the current RAM is at maximum capacity for the motherboard before ordering additional modules | High — RAM exhaustion causes frequent zero-window events that degrade interactive responsiveness noticeably during content loads |
| Zero-window events well above baseline; no TCP retransmissions; disk I/O above 80% during stall | Disk I/O saturation: the CMS is writing media assets to local storage at a rate the storage device cannot sustain, blocking buffer drain | Upgrade from a hard disk drive (HDD) to a solid-state drive (SSD) or eMMC storage; for Linux systems, check whether the CMS writes cache to a separate partition and whether that partition is on a slower storage device; an SSD reduces local write latency by two orders of magnitude, eliminating disk I/O as a zero-window cause in almost all display PC deployments | High — HDD storage is the single most common hardware cause of zero-window pressure on recognition display PCs with large media libraries |
| Zero-window events at baseline rate; TCP retransmissions significantly above baseline; switch port shows input errors | Physical layer packet loss: cable degradation, a marginal SFP, or a duplex mismatch on the display's access port is causing dropped packets that the CMS server must retransmit | Inspect the Ethernet cable between the display PC and the wall jack; replace the patch cable; check the access switch port for duplex mismatch (10/100/1000 auto-negotiation failure); re-seat or replace SFP if applicable; clear error counters after remediation and monitor for recurrence | High — physical-layer errors cause retransmission-induced stalls that are indistinguishable from application-layer stalls without packet capture confirmation |
| Zero-window events at baseline rate; TCP retransmissions significantly above baseline; switch port shows no errors | Network path congestion or misconfiguration: packet loss is occurring between the access switch and the CMS server — at an upstream switch, the school's WAN link, or a firewall policy — with no physical errors at the access layer | Check link utilization on the school's WAN uplink during the stall window; check firewall session table for the display's CMS connection; verify the display VLAN's QoS policy is not rate-limiting CMS traffic; test with a traceroute during the stall to identify where packet loss is occurring in the path to the CMS server | Medium — upstream path congestion is intermittent and may clear without intervention; persistent retransmissions without physical errors warrant a QoS or WAN capacity investigation |
| Zero-window events well above baseline; TCP retransmissions also elevated; CPU and RAM near normal | Mixed cause: the display PC is experiencing moderate zero-window pressure at the same time the network path has elevated packet loss; both conditions are contributing to the stall | Address network-path retransmissions first (switch, VLAN, QoS); re-run the comparison capture after resolving the retransmission cause; if zero-window events remain elevated after the network is clear, proceed with CPU and RAM investigation; resolving both independently prevents the interference of one condition masking the other during diagnosis | Medium — combined conditions are the hardest to diagnose; sequential remediation (network first, then device) prevents circular troubleshooting |
| Zero-window events and retransmissions both at baseline rate; stall reported but not captured in traffic | Application-layer stall: the TCP connection is healthy; the stall is occurring in the CMS application itself — a rendering timeout, a content asset that failed to load from CMS storage, or a CMS session expiry causing the application to wait for re-authentication | Check the CMS application logs on the display PC for errors during the stall window; check the CMS management portal for the display's session events; contact the CMS vendor if logs show repeated asset-fetch failures or authentication retries during the stall period — these are not network issues and do not respond to TCP-layer remediation | Medium — application-layer stalls are often mistakenly treated as network problems; confirming the TCP layer is clean before escalating to the CMS vendor saves significant diagnostic time |
| Baseline zero-window rate increasing over successive monthly re-baselines with no change in content load | Resource creep: background processes, accumulated log files, CMS cache growth, or OS-level fragmentation are progressively consuming resources that were available at commissioning | Schedule a seasonal display PC maintenance window: remove accumulated log files and CMS cache (per CMS vendor guidance), run OS updates during the maintenance window rather than in-band, and re-run the baseline capture after maintenance; for displays with HDDs, run a disk defragmentation (Windows) or TRIM (Linux SSD) during the maintenance window; schools that maintain [ongoing hall-of-fame update schedules](https://digitalwalloffame.com/blog/hall-of-fame-obituary-update-policy/) benefit from adding a zero-window re-baseline to the annual recognition program maintenance schedule | Low — resource creep is gradual; monthly monitoring catches it before it causes user-visible stalls |
Troubleshooting: Common Zero-Window Baseline Failures
| Symptom | Probable Cause | Resolution |
|---|---|---|
| Wireshark shows no zero-window events in baseline capture even during a known stall period | The capture filter is not capturing the correct traffic; the CMS server IP in the filter may be stale (the CMS server's IP changed), or the display is connecting to the CMS through an HTTPS proxy that terminates the TCP connection before it reaches the display OS | Confirm the current CMS server IP from an active connection: netstat -n | findstr :443 (Windows) or ss -tn | grep ESTAB (Linux). If the IP has changed, update the capture filter. If the display routes through an explicit HTTPS proxy, capture traffic to the proxy IP — the zero-window events will appear on the display-to-proxy connection, not the proxy-to-CMS connection |
| Baseline shows very high zero-window events even with no user-reported stalls | The baseline was captured during a period of hidden background activity — an OS update download, an antivirus scan, or a CMS library sync of a large new content batch — that temporarily elevated zero-window events without causing a visible stall long enough to be reported | Review the Task Manager or system log for the baseline capture period to identify any background process active at that time. Re-run the baseline at a time when no large background tasks are occurring. If repeated baseline captures consistently show high zero-window event rates even without background tasks, the display PC is chronically under-resourced — investigate RAM and disk I/O as the root cause before accepting the elevated rate as a valid baseline |
| Zero-window events appear in the stall capture but the rate is the same as the baseline — no anomaly | The stall is not caused by receiver-side resource pressure; the TCP layer is operating within its normal parameters; the stall is either at the application layer (CMS rendering, content fetch failure) or is caused by brief packet loss that cleared before the comparison capture was run | Check the CMS application log for errors during the stall window. Check the switch port for error counter increments around the stall time. If both are clean, the stall may be caused by an intermittent WAN outage of a few seconds — enough to interrupt a content load but too brief to generate significant retransmissions in the capture. Ask the CMS vendor whether their platform logs content delivery failures with timestamps that can be cross-referenced against the stall report time |
| Linux tcpdump command produces an empty pcap file | The network interface name used in the -i flag is incorrect for the display PC; modern Linux distributions use predictable interface names such as enp3s0 or eno1 rather than eth0 | Run ip link show to list active network interfaces and their names. Use the correct interface name in the tcpdump command. If the display uses Wi-Fi, substitute the wireless interface name — though a wired connection is strongly recommended for recognition display installations: Wi-Fi introduces variability that can mask or mimic both zero-window and packet-loss patterns |
| Stall capture shows zero-window events concentrated in a specific 10-second window, then normal for the rest of the capture | A single large content asset — a high-resolution video clip or a batch of high-resolution athlete photos — caused a brief buffer saturation that the OS recovered from quickly; this is a content-load-specific zero-window event, not a chronic resource constraint | Confirm which content asset was loading when the zero-window burst occurred by cross-referencing the capture timestamp with the CMS activity log. If the asset is a video clip, check whether the CMS allows the video bitrate or resolution to be reduced for display playback. Schools that have expanded their [state championship bracket content](https://digitalyearbook.org/blog/best-displays-high-school-state-championship-brackets/) or added high-resolution team highlight videos recently may encounter brief zero-window bursts on their first load cycle that do not recur after the asset is cached locally |
| Zero-window events are consistently elevated at the same time each day | A scheduled task — antivirus scan, OS update check, CMS overnight content sync, or log rotation — is running at that time and competing with the CMS application for resources | Identify the scheduled task using Task Scheduler (Windows) or crontab -l and systemctl list-timers (Linux). Reschedule the task to a low-traffic period, typically 2:00–5:00 AM for school recognition displays. After rescheduling, re-run the baseline capture during the previously problematic time window to confirm zero-window events return to the normal rate |
Post-Baseline Steps Before Returning to Unattended Operation
After the baseline is captured and documented, complete these steps before closing the commissioning session or returning the display to unattended operation.
Store the pcap file and baseline metrics in a durable location. The pcap file and the documented event rate are only useful if they survive a PC re-image or IT staff transition. Save the pcap to a shared network drive or the school’s IT asset management system alongside the display’s commissioning record. The file name should include the display location, date, and OS version so a future IT coordinator can identify it without opening it.
Add a scheduled re-baseline reminder to the IT maintenance calendar. The zero-window baseline should be re-run at the start of each school year, after any summer OS re-image, and after any significant expansion of the display’s media content library. Schools that add new athletes to their recognition display programs each season should include a zero-window re-baseline in the seasonal content update procedure, since a larger media library increases the peak content-load payload and can push a display PC that was previously within its resource margins over the threshold.
Set a threshold for the next investigation. Based on the documented baseline event rate, establish an explicit threshold: if a stall capture shows a zero-window event rate more than twice the baseline, the display PC resources should be investigated before assuming a network cause. Document this threshold in the commissioning record so future IT staff have a clear criterion rather than relying on subjective assessment.
Check whether zero-window events in the baseline correlate with any user-visible content stalls. Review the display’s CMS activity log for the baseline capture window. If the CMS log shows no content load delays during the baseline period but the capture shows a non-zero zero-window event rate, the events are brief and self-resolving — acceptable baseline behavior. If the CMS log shows slow content sync timestamps that correlate with the zero-window events, even the baseline may represent marginal resource adequacy; consider a hardware upgrade before the content library grows further.
Document the display’s RAM and storage configuration at baseline time. If the display is later upgraded — RAM increased, storage replaced — the prior baseline no longer represents the current hardware configuration. Re-run the baseline after any hardware change and document the new configuration alongside the new baseline metrics. Schools that have invested in comprehensive digital alumni and recognition programs and plan to grow their content libraries over the coming years benefit from knowing both the current zero-window baseline and the hardware headroom available before the next baseline inflection point.
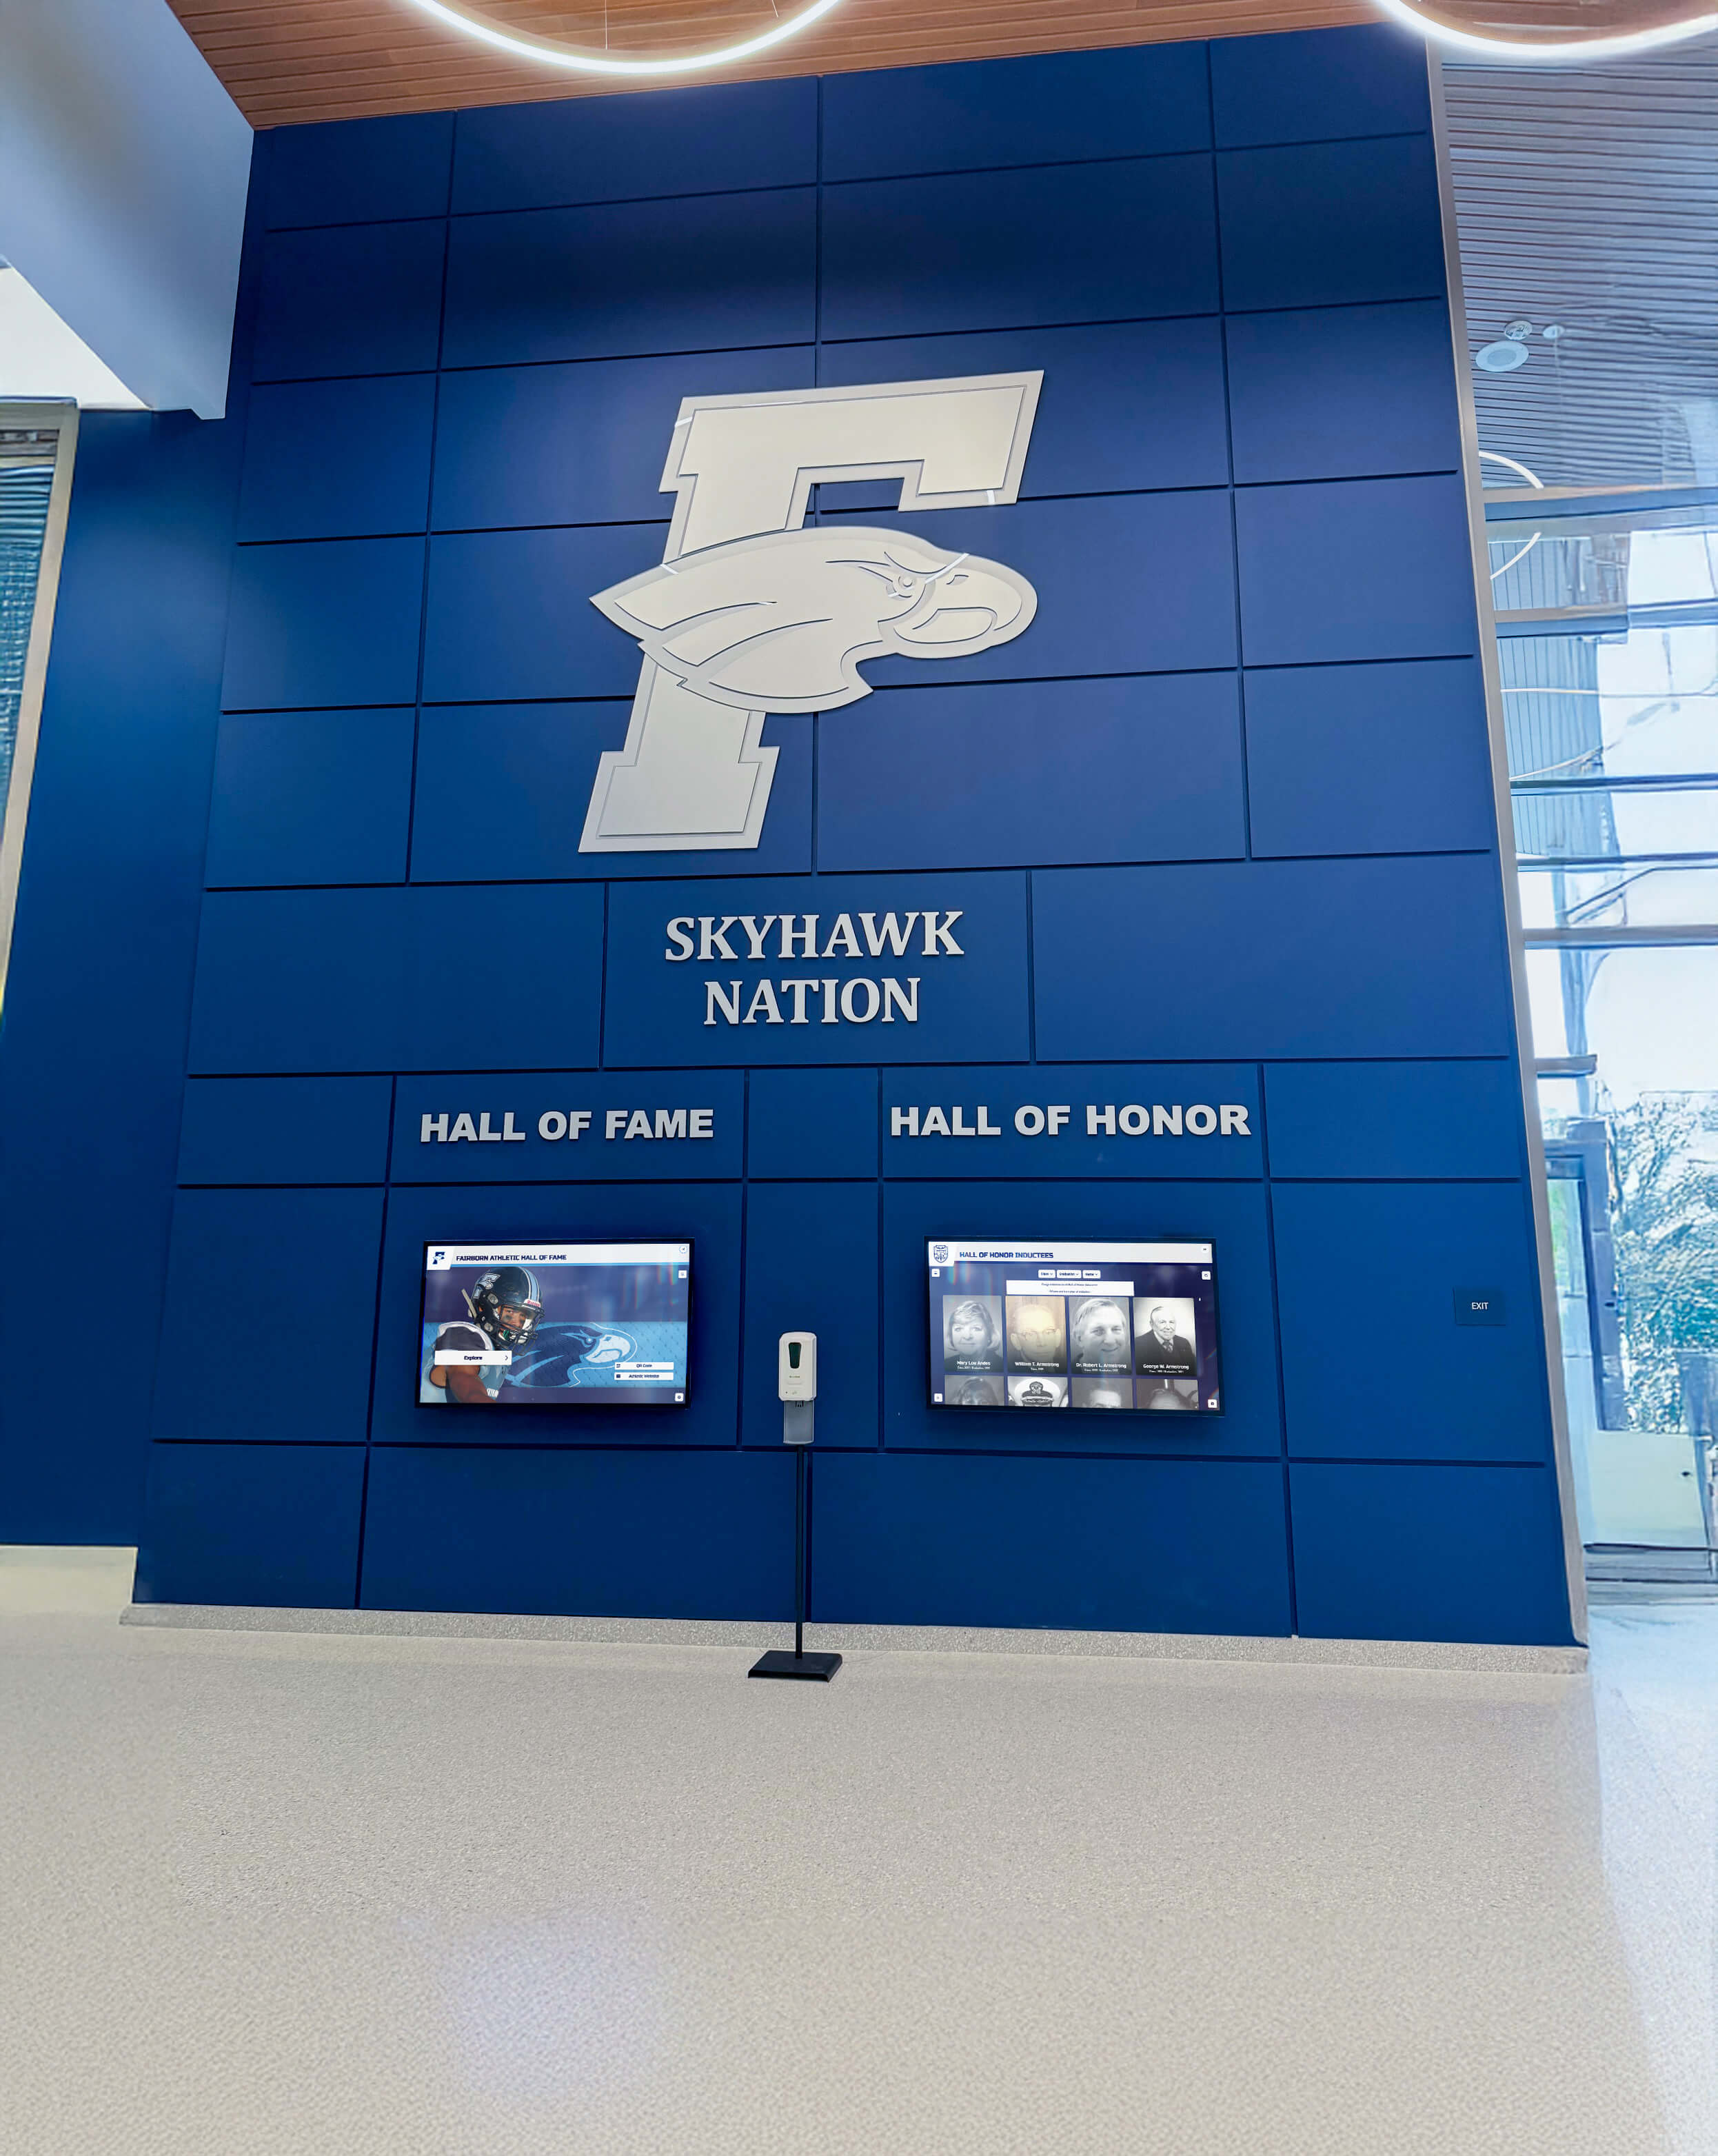
A zero-window baseline stored alongside the display's hardware specification — RAM, storage type, OS version, and capture date — allows future IT staff to determine whether a new stall reflects deteriorated conditions or a hardware upgrade that changed the baseline, without re-running the full capture procedure from scratch
Multi-Display Considerations for Zero-Window Baselining
Schools running recognition displays at multiple locations — a main lobby hall-of-fame wall, an athletics corridor, and a donor recognition screen — should not assume that a baseline captured at one display location applies to any other.
Each display PC has independent hardware resources. A lobby display running on a media PC with 8 GB RAM and an SSD will have a fundamentally different zero-window baseline than an athletics corridor display running on a four-year-old PC with 4 GB RAM and an HDD. Run and document the baseline independently for each display PC. Use the per-display baseline to interpret stall captures from that specific display only.
Content libraries differ by display location. The main lobby hall-of-fame display may show all varsity sports with full photo and video libraries, while a corridor display shows a single sport with a smaller media set. The per-display content load determines the expected zero-window event rate at peak content load, independent of hardware. Two identical PC configurations can have different baselines if their content libraries differ significantly in media size and complexity.
Maintenance schedules may differ by VLAN or building. Schools with recognition displays across multiple buildings may apply different OS update schedules, antivirus scan schedules, or CMS sync windows to displays on different VLANs. A display that receives OS updates at 2:00 AM may show a clean baseline, while a display on a different VLAN that receives updates at 7:00 AM — just as students arrive and content loads are highest — will show update-related zero-window spikes during morning operation. Document the maintenance schedule for each display’s VLAN alongside the baseline to make schedule-correlated zero-window events identifiable.
Baseline re-runs should be staggered, not simultaneous. Running baseline captures on multiple display PCs simultaneously — for example, during a summer commissioning session — introduces the risk that the school’s WAN link or content delivery network is handling multiple simultaneous large content loads, which could elevate retransmission rates across all displays and confound the individual baseline results. Stagger baselines by at least thirty minutes per display, or run them on separate days if the school’s internet connection is limited. Schools with recognition display programs that span multiple buildings and campuses benefit from treating each display as an independent baseline unit — a finding at one location cannot be extrapolated to any other.
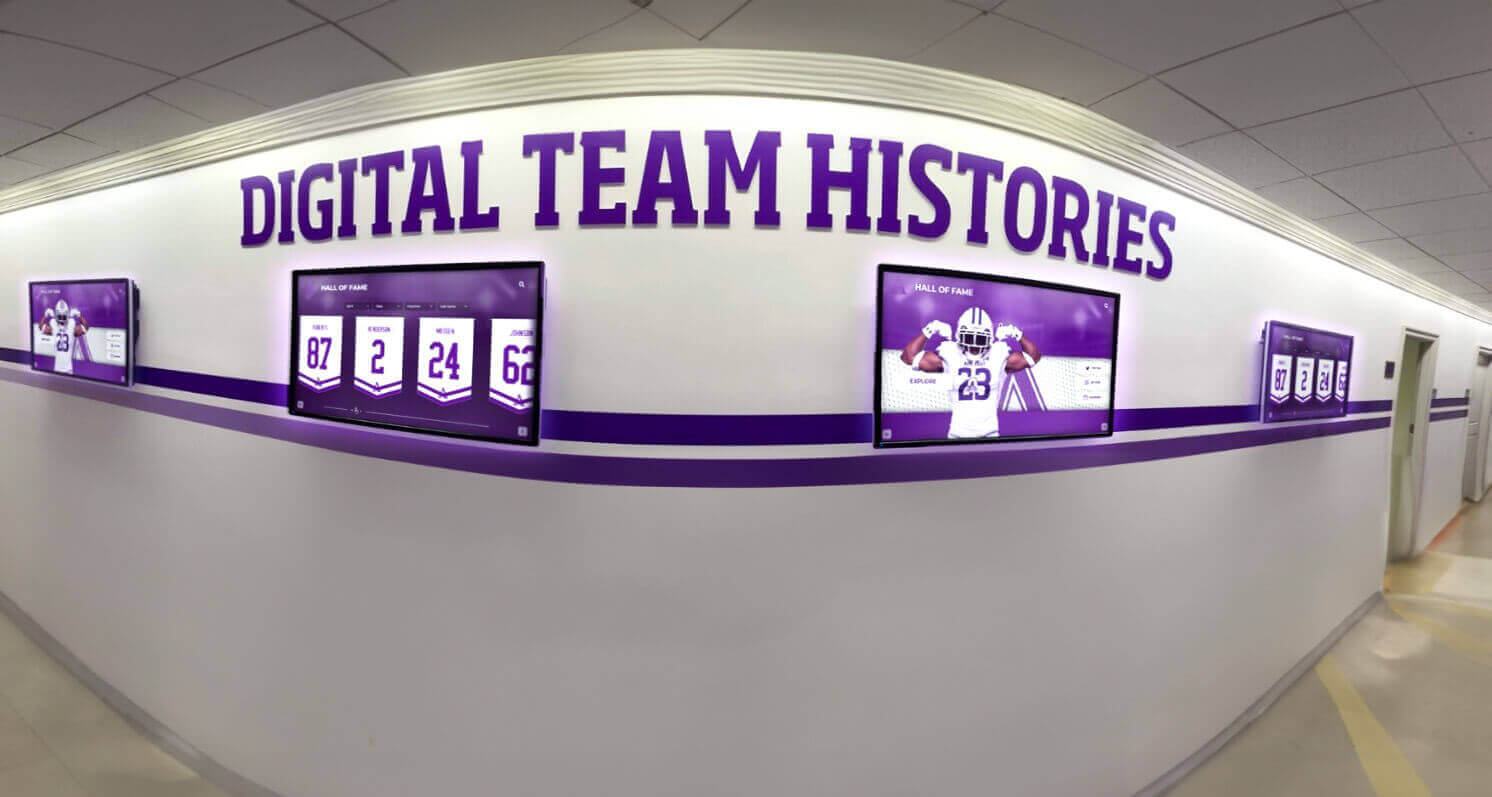
Schools running recognition displays across multiple hallways should capture and document zero-window baselines independently at each display location — hardware differences, content library size, and per-VLAN maintenance schedules mean that a baseline from one display cannot be applied to any other
Frequently Asked Questions
How many zero-window events per minute is normal for a recognition display?
There is no universal normal rate — the baseline for each display depends on its hardware, content library, and CMS sync frequency. A display with 8 GB RAM, an SSD, and a moderate content library may run an entire 30-minute capture with zero zero-window events. A display with 4 GB RAM, an HDD, and a large video-heavy media library may show two to five zero-window events per minute even during healthy operation. The baseline procedure establishes the normal rate for each specific display. The comparison between the baseline and a stall capture is the diagnostic metric — not the absolute event count.
Can zero-window events cause content to appear on the display incorrectly, or only delay it?
Zero-window events cause delivery pauses, not data corruption. TCP guarantees in-order, complete delivery of all bytes — a zero-window condition pauses the data stream but does not drop or reorder any bytes. When the receiver’s buffer drains and the window reopens, the CMS server resumes delivering data from exactly where it paused. The content that eventually appears on the display is correct. The user-visible symptom is a stall or slow load, not incorrect or corrupted content.
Should I run the baseline capture on the display PC itself or on a port mirror?
Running the capture directly on the display media PC is preferable for zero-window analysis because zero-window events are generated by the display’s OS. A port mirror captures the same packets but does not capture the OS’s internal buffer state. In practice, both methods produce identical results for zero-window detection — the [TCP ZeroWindow] packets are visible in the network traffic regardless of where the capture is taken. However, running Wireshark on the display PC itself also allows correlation with Task Manager or htop data open simultaneously, which makes CPU, RAM, and I/O correlation much easier. If installing Wireshark on the display PC is not permitted by the school’s OS image policy, a port mirror capture on the access switch is a fully valid alternative.
Does zero-window pressure affect the display’s touch responsiveness, or only content loading?
Zero-window pressure directly affects only TCP data delivery — the rate at which the CMS server can push content to the display. Touch input is handled by the local OS touch driver and the CMS application’s input processing, independent of TCP receive-buffer state. In practice, however, a display that is experiencing CPU pressure severe enough to cause zero-window events may also show degraded touch responsiveness, because the same CPU contention that is preventing buffer drain is also slowing the CMS application’s input handling. A display that stalls on content load and also responds sluggishly to touch input has a CPU bottleneck, not just a buffer issue.
Is it safe to run a packet capture on the display PC while visitors are using the display?
Yes — a packet capture captures only TCP traffic between the display and the CMS server (with the host <CMS-server-IP> filter). The capture does not intercept or record the visitor’s touch interactions, which are processed locally by the CMS application. The capture file contains only network packet data (source/destination IP, port, TCP flags, payload size) — it does not contain any personally identifiable information about visitors. Wireshark and tcpdump operate silently in the background; visitors interacting with the display are not aware of the capture. Run the capture with a specific host filter to limit the capture to the CMS server connection and avoid inadvertently capturing traffic to other services.
How does TCP receive window size relate to zero-window conditions?
The TCP receive window is the maximum amount of unacknowledged data the receiver is willing to hold in its buffer at any moment. A typical modern OS advertises a receive window of 64 KB to several megabytes through TCP window scaling (RFC 7323). Zero-window conditions occur when the in-flight data volume reaches this advertised window — meaning the receive buffer is completely full. The larger the receive window, the more data the CMS server can send before the display’s buffer fills. Displays running on hardware with low RAM may have a smaller effective TCP receive window because the OS limits the buffer size based on available memory. If a baseline capture shows the receive window consistently near zero even between zero-window events, it is a sign that the OS has constrained the receive window due to low available RAM — another indicator of an underpowered display PC.
Establishing a school recognition display TCP zero window baseline gives IT staff the diagnostic foundation to tell receiver-side resource pressure apart from network packet loss the next time a hall-of-fame kiosk, athletic record board, or donor wall screen stalls or loads slowly. A fifteen-minute capture during healthy operation, analyzed for zero-window event rate in Wireshark, becomes a reference that any future stall capture can be compared against — pointing the investigation toward the display PC’s CPU, RAM, and storage if zero-window events are elevated without retransmissions, or toward the switch port, VLAN, and upstream link if retransmissions are elevated without zero-window pressure. Document the baseline event rate, the display PC’s hardware configuration, and the pcap file location in the commissioning record. Re-run the baseline at the start of each school year, after any hardware or OS changes, and after significant content library expansions. The goal is a reference point that survives staff transitions and summer maintenance cycles — so the next time the display stalls before a hall-of-fame induction ceremony, the diagnosis takes minutes, not hours.
Looking for a recognition display partner that provides network configuration guidance, hardware specifications, and ongoing remote monitoring — so your school IT team has the context to diagnose and resolve display issues quickly? Rocket Alumni Solutions deploys hall-of-fame kiosks, athletic record boards, and donor recognition displays for schools with complete network readiness documentation and managed CMS support throughout the school year. Request a demo to see how Rocket Alumni Solutions supports school IT teams from commissioning through seasonal content updates.