Intent: demonstrate — this guide walks school IT coordinators, athletic directors, and facilities teams through a recognition display bufferbloat test to measure the latency-under-load baseline on the network path serving hall-of-fame kiosks, athletic record boards, and donor recognition displays, so that delayed video starts, sluggish touch response, and stalled content syncs can be diagnosed accurately and corrected before they undermine the program’s day-to-day credibility.
Bufferbloat is the condition where large, unmanaged buffers at routers, modems, or switches hold queued packets for an extended time when the network link is saturated. Under idle conditions the same network may show 10–20 ms round-trip latency; under load — during morning device check-ins, video streaming in classrooms, or a large software update — latency spikes to several hundred milliseconds. A recognition display experiencing bufferbloat shows symptoms that look like hardware failure: video highlights that take 8–12 seconds to begin playing, touch interactions that register half a second after contact, and cloud CMS syncs that stall mid-transfer. None of these are display defects. All of them are predictable consequences of untested, unmanaged buffering on the school’s uplink or edge router. Establishing a documented baseline with a structured bufferbloat test gives IT teams a measurable threshold to reference when these symptoms recur and a clear remediation path when the measured latency exceeds acceptable limits.
The quick answer: use a browser-based bufferbloat test — the Waveform Bufferbloat Test or a comparable latency-under-load tool — directly from the recognition display’s media PC during a scheduled high-traffic period. Record the idle latency, the loaded latency, and the calculated bufferbloat grade. A display on a well-managed school network should show idle latency under 20 ms, loaded latency under 80 ms, and a bufferbloat grade of A or B. Loaded latency above 200 ms consistently correlates with observable video delays and degraded touch response. If the loaded latency exceeds that threshold, the remediation path is Active Queue Management (AQM) at the edge router — specifically FQ-CoDel or CAKE — rather than display hardware replacement or CMS configuration changes.
This procedure applies to any recognition display running on a dedicated media PC, embedded player, or kiosk appliance connected to the school network by Ethernet or Wi-Fi, regardless of display size or vendor. The test methodology is the same for a 55-inch lobby kiosk and an 86-inch corridor athletic record board.
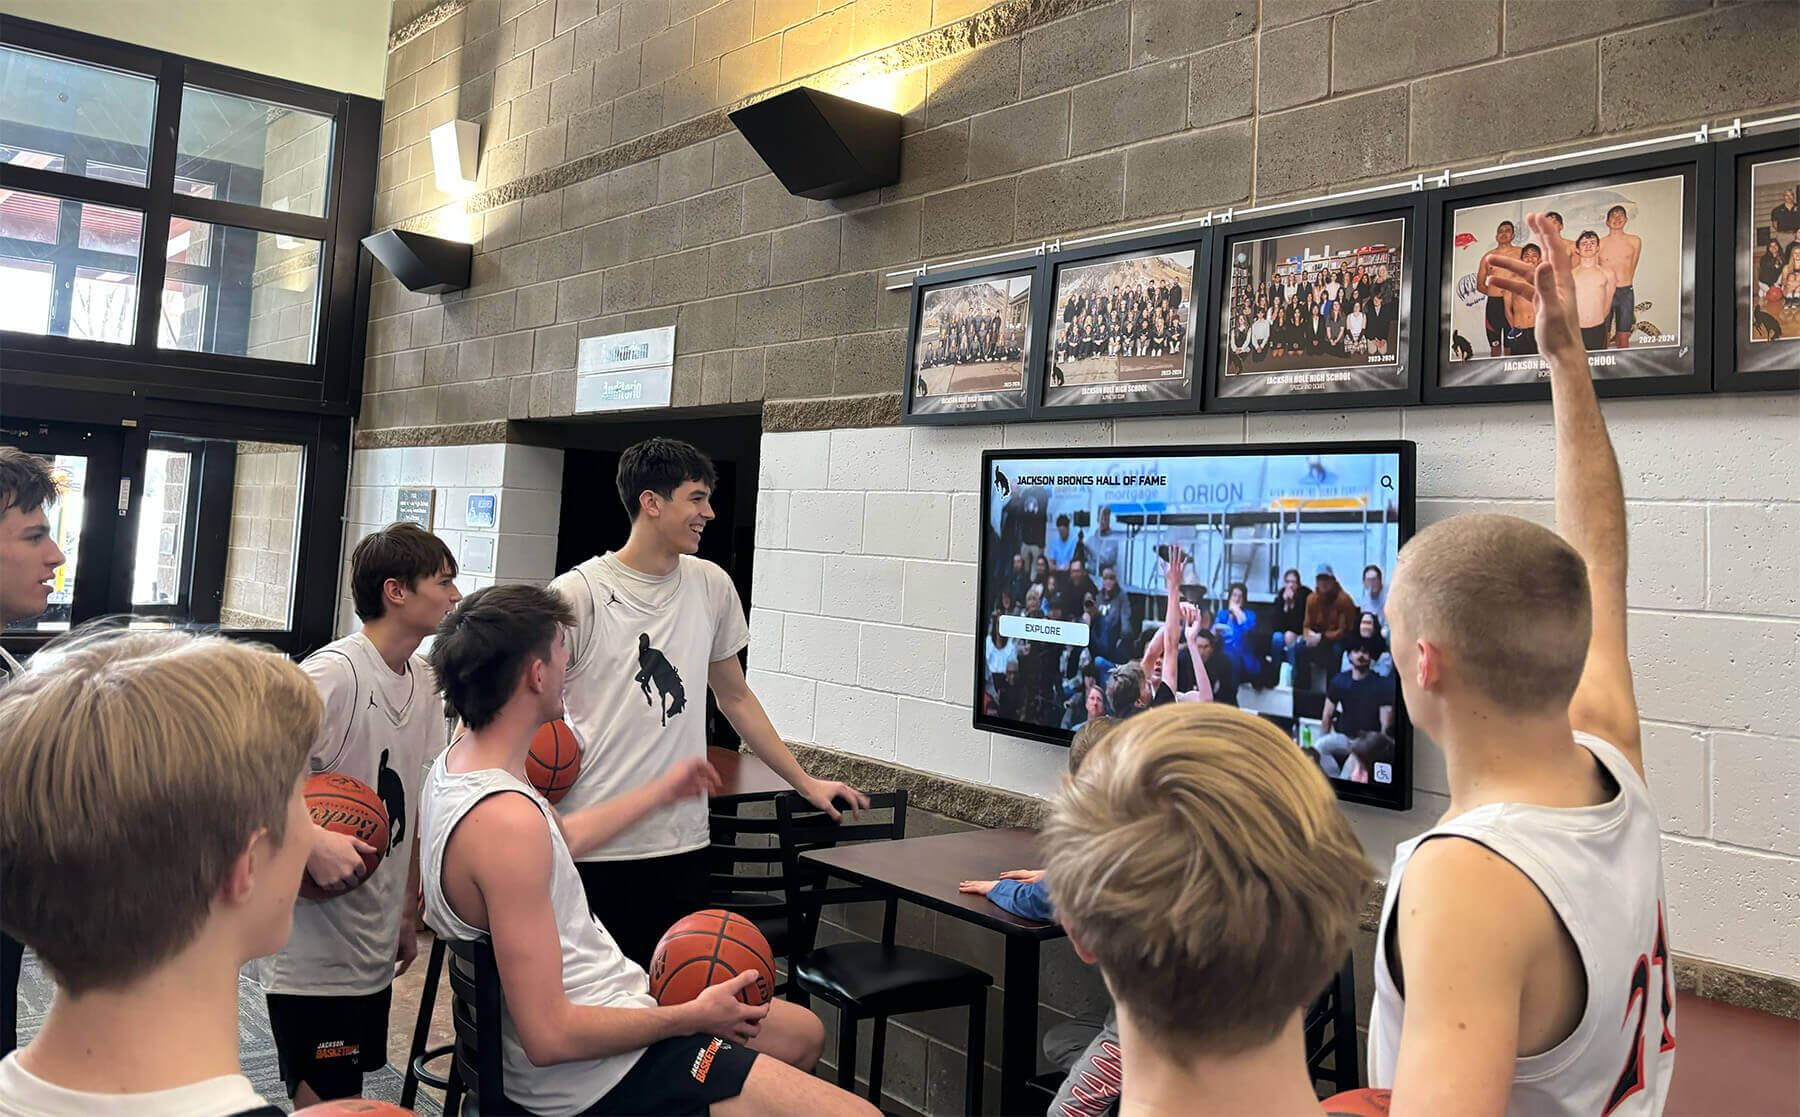
Game highlight video on a recognition display stalls during peak network hours not because the display or CMS is broken, but because unmanaged router buffers spike latency under load — a bufferbloat test identifies this in minutes and points directly to the correct remediation
What Is Bufferbloat and Why Does It Affect Recognition Display Video?
Bufferbloat is a term coined by networking researcher Jim Gettys in 2011 to describe a specific network quality problem: excessively large buffers at routing and switching devices that hold queued packets far longer than necessary, causing latency to spike dramatically whenever a network link approaches saturation.
Every router, switch, and modem has transmit and receive queues — temporary buffers that hold packets when the device cannot forward them immediately. In moderate amounts, these buffers prevent packet loss during brief traffic bursts. The problem occurs when buffer sizes are set far larger than necessary — a practice that became common as memory prices dropped and equipment manufacturers defaulted to maximum buffer sizes to avoid any appearance of packet loss in basic speed tests.
When a school’s internet uplink or edge router is operating under load, those large buffers fill with queued packets. Each new packet must wait for every queued packet ahead of it to be transmitted before it reaches its destination. On a heavily loaded link, this queuing delay can reach 300–800 ms or more. Idle latency remains 10–20 ms because there is nothing in the queue; loaded latency spikes because the queue is full.
How School Networks Accumulate Bufferbloat
School networks are particularly susceptible to bufferbloat for three reasons:
High-demand morning windows. When several hundred student devices connect simultaneously at the start of the school day — downloading updates, syncing cloud drives, streaming instructional video — the school’s internet uplink reaches or exceeds capacity. During this window, the edge router’s transmit queue fills to its maximum depth and stays there for an extended period. Any packet entering the queue during this window — including TCP acknowledgments from the recognition display’s CMS connection and HTTP requests for video content — waits behind the backlog.
Asymmetric uplink saturation. Many school internet connections are asymmetric: download capacity is 5–10× the upload capacity. Video streaming by students consumes download bandwidth. But the recognition display’s TCP connections generate acknowledgment packets (ACKs) in the upload direction. When the upload path becomes congested — which happens faster and more severely on asymmetric connections — TCP throughput for the CMS download collapses because the display cannot send ACKs fast enough. The display stops receiving video data not because the download link is full, but because the upload link is congested with competing TCP ACKs.
Legacy edge equipment without AQM. Many school edge routers and cable or DSL modems shipped without Active Queue Management enabled by default. AQM algorithms — FQ-CoDel, CAKE, PIE, and similar — manage buffer occupancy actively, dropping or delaying packets before the buffer fills completely, keeping latency low even under load. Equipment without AQM fills its buffers passively and drains them slowly, maximizing bufferbloat impact.
Recognition Display Symptoms Caused by Bufferbloat
When bufferbloat is present on the network path between the school’s recognition display and its cloud CMS, three observable symptoms appear during peak network hours:
Delayed video starts. Video highlights, championship replay clips, and recognition program intro sequences stored in the CMS require a brief data transfer burst at playback start. When the network path is congested, this burst competes with hundreds of other flows in the router’s queue. The display’s video player requests the first segment of the video, the CMS server sends it, and the data sits in the router’s queue waiting for capacity. The video player shows a loading spinner for 6–15 seconds before playback begins — a delay that appears to spectators as a broken or sluggish display.
Sluggish touch response. Touchscreen recognition displays — hall-of-fame kiosks with interactive athlete profiles, donor walls with searchable donor histories, and athletic record boards with filter-based navigation — register a physical touch interaction locally on the device, then send a data request to the CMS for the next content item. If the network path is congested when that data request is sent, the response is delayed by the bufferbloat window. A touch that should produce an immediate screen transition instead produces a 1–3 second delay. Users interpret this as unresponsive hardware and stop interacting with the display.
Stalled CMS content syncs. Cloud CMS platforms that deliver recognition content — athlete records, award histories, event announcements, updated sponsor content — push changes to the display over HTTPS connections maintained throughout the day. When bufferbloat causes TCP acknowledgment delays, these long-lived connections slow their transfer rate through TCP’s congestion avoidance mechanisms. A content update that would transfer in under 5 seconds on an unloaded network may take 2–3 minutes on a heavily bufferbloated connection. New honoree additions and schedule updates that program coordinators expect to appear within minutes of publishing may not reach the display until network load drops in the evening.
Tools Required for the Recognition Display Bufferbloat Test
The bufferbloat test requires no specialized hardware and uses browser-based tools that run directly on the recognition display’s media PC. The core tools are free and do not require account creation.
| Tool | Purpose | Where to Access |
|---|---|---|
| Waveform Bufferbloat Test | Primary bufferbloat measurement — reports idle latency, loaded latency, download and upload speed, and an overall bufferbloat grade (A through F) | waveform.com/tools/bufferbloat |
| LibreQoS DSL Reports Test | Alternative bufferbloat test with per-direction loaded latency breakdown — useful for identifying asymmetric upload congestion | dslreports.com/speedtest |
| ping (command prompt or terminal) | Manual idle latency baseline — run before the browser test to confirm the network is in a representative state | Built into Windows, macOS, and Linux |
| Switch management interface | Check interface utilization on the uplink port during the test window to confirm the link was under load during measurement | SSH or web UI on the managed access switch |
| CMS admin panel | Confirm content sync timestamp before and after the test to measure real-world CMS transfer delay | Login provided by the recognition display platform |
Step-by-Step Recognition Display Bufferbloat Test
Complete these steps during a representative high-traffic period — typically between 8:00 AM and 10:00 AM on a school day when student devices are actively connecting. Running the test on a Saturday afternoon or after school hours will produce artificially low loaded-latency numbers that do not reflect peak conditions.
Step 1: Establish an Idle Latency Baseline
Before running any load-generating test, measure the network’s idle round-trip latency from the recognition display.
On the display’s media PC, open a command prompt (Windows) or terminal (Linux/macOS) and run a continuous ping to a reliable public DNS server:
ping -t 8.8.8.8
(On Linux or macOS: ping 8.8.8.8)
Allow the ping to run for 30 seconds with no other applications generating traffic. Record the average round-trip time (RTT) from the ping statistics. This is your idle latency baseline.
Expected idle latency for a well-connected school display:
| Connection Type | Acceptable Idle Latency | Investigate If |
|---|---|---|
| Fiber internet uplink | 5–15 ms | > 25 ms |
| Cable internet uplink | 10–25 ms | > 40 ms |
| DSL internet uplink | 15–40 ms | > 60 ms |
| Wi-Fi connected display | 15–35 ms (add 10 ms per hop) | > 60 ms |
If idle latency exceeds the “Investigate If” threshold before any load is applied, the display may be on the wrong VLAN, routing through an unexpected path, or experiencing a separate network issue unrelated to bufferbloat. Resolve the idle latency issue before proceeding to the load test.
Step 2: Open the Bufferbloat Test Tool
On the recognition display’s media PC, open a web browser and navigate to the Waveform Bufferbloat Test at waveform.com/tools/bufferbloat.
Do not close the ping window from Step 1 — keep it running in a background terminal. The simultaneous ping will show you the manual latency impact in real time as the browser test generates load.
Step 3: Run the Bufferbloat Test During a High-Traffic Period
Click the Start Test button. The Waveform test runs a multi-thread download and upload simultaneously while measuring round-trip latency throughout the test. The test takes approximately 30–45 seconds to complete.
During the test, observe the ping window from Step 1. You should see the RTT values increase significantly from the idle baseline as the test saturates the uplink. Note the peak RTT value you observe in the ping window — this is your direct observation of the bufferbloat impact.
After the test completes, the Waveform tool displays:
- Download speed and Upload speed in Mbps
- Idle latency (measured before the load begins)
- Download latency (latency measured while download is saturating the link)
- Upload latency (latency measured while upload is saturating the link)
- Bufferbloat grade — A (excellent, under 5 ms added latency under load) through F (severe, over 500 ms added latency under load)
Record all values. Run the test three times — at the start, middle, and end of the peak traffic window — and average the results. A single test during an unusual traffic lull will not represent normal school-day conditions.
Step 4: Record the Loaded Latency Baseline
From the three test runs, calculate:
- Average idle latency — the mean of the three idle latency measurements
- Average loaded latency — the mean of the three download-loaded or upload-loaded latency measurements, whichever is higher
- Bufferbloat overhead — average loaded latency minus average idle latency
Document these values with the date, time, and network conditions (school day, approximate number of active devices if known) so they serve as the baseline for future comparisons.
Step 5: Correlate With CMS Content Sync Timing
While the bufferbloat test is running — or immediately after — trigger a content update from the CMS admin panel. Publish a test record or update an existing athlete profile. Record the timestamp when you clicked Publish and the timestamp when the change appeared on the display’s screen.
Under acceptable network conditions (bufferbloat grade A or B), this round-trip should complete within 15–30 seconds for a small record update. Under severe bufferbloat conditions (grade D or F), the same update may take 2–8 minutes during peak hours.
Document the observed CMS sync delay alongside the bufferbloat measurements. If sync delay correlates with high loaded latency, you have confirmed that bufferbloat is the cause — not a CMS platform issue, a firewall misconfiguration, or a display hardware problem.
Step 6: Verify the Link Was Under Load During the Test
After recording the test results, log into the access switch serving the recognition display and check interface utilization on the uplink port during the test window.
On a Cisco IOS switch:
Switch# show interfaces GigabitEthernet1/0/1 | include rate
  5 minute input rate 8456000 bits/sec, 1023 packets/sec
  5 minute output rate 48712000 bits/sec, 987 packets/sec
Confirm that the uplink was carrying substantial traffic during the test window. A bufferbloat test run when the uplink is under 10% utilization will show artificially low loaded latency — the queue never fills because there is excess capacity. The test is only meaningful when the link is at 50–90% utilization or higher.
If the uplink shows low utilization even during the morning peak, the bufferbloat problem may be at the ISP’s equipment rather than at the school’s edge router — a condition that requires working with the internet service provider to address.
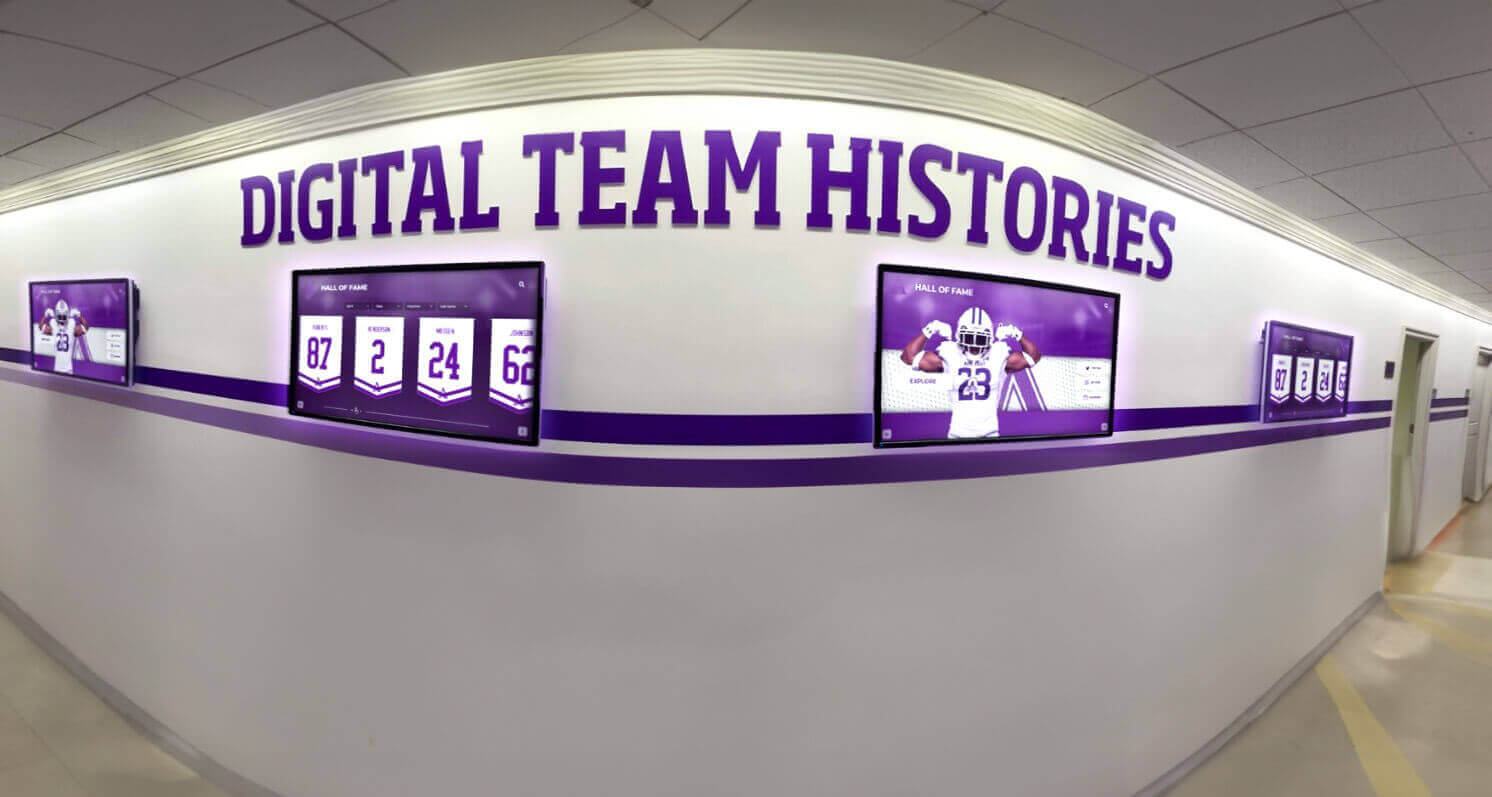
A corridor of recognition displays sharing a common uplink amplifies the impact of bufferbloat — a single bufferbloated router upstream affects content delivery to every display on the segment simultaneously
Bufferbloat Baseline Reference Table
Use this table to interpret the test results and determine the urgency and type of remediation.
| Bufferbloat Grade | Idle Latency | Loaded Latency | Added Latency Under Load | Recognition Display Impact | Recommended Action |
|---|---|---|---|---|---|
| A (Excellent) | < 20 ms | < 25 ms | < 5 ms | None — video starts promptly, touch response immediate, CMS syncs reliably | Document as baseline; re-test quarterly |
| B (Good) | < 20 ms | < 60 ms | 5–40 ms | Marginal — occasional brief video buffering under extreme load; touch response acceptable | Document baseline; monitor for degradation |
| C (Acceptable) | < 25 ms | < 120 ms | 40–100 ms | Noticeable — video starts delayed 1–3 seconds during peak hours; occasional touch lag | Enable AQM on edge router if possible; check uplink for over-subscription |
| D (Poor) | Any | 120–400 ms | 100–380 ms | Significant — video delays 5–10 seconds; touch interactions feel unresponsive; CMS syncs stall regularly | Enable FQ-CoDel or CAKE on edge router; contact ISP; consider uplink upgrade |
| F (Severe) | Any | > 400 ms | > 380 ms | Severe — display appears broken; video rarely loads during peak hours; CMS updates may take hours | Immediate remediation required — AQM and/or uplink upgrade; isolate display on QoS priority queue as interim measure |
Interpreting Results and Remediation
When the Grade Is A or B
The network path serving the recognition display is well-managed. If users are still reporting video delays or touch lag, the cause is not bufferbloat — investigate display hardware (RAM, storage, thermal throttling), CMS platform response time during peak server load, or local switch configuration issues such as VLAN misassignment or a misconfigured QoS policy that is actually deprioritizing display traffic.
When the Grade Is C
The network has manageable bufferbloat that may become noticeable under sustained peak load. Two options apply:
Option 1 — Enable AQM on the edge router. If the school’s edge router or firewall supports Active Queue Management (AQM) — typically FQ-CoDel, CAKE, or PIE — enable it on the WAN interface. Most pfSense, OPNsense, and modern Cisco/Fortinet/Meraki deployments support at least one AQM algorithm. FQ-CoDel is the most widely available and typically reduces loaded latency to under 30 ms even on a fully saturated link.
Option 2 — Set an explicit bandwidth cap below the line rate. On routers that support traffic shaping, setting the outbound WAN queue rate slightly below the ISP’s advertised speed (typically 85–90% of line rate) prevents the buffer from filling and reduces bufferbloat without requiring full AQM. This is a lower-quality substitute for AQM but improves the situation when AQM is not available.
When the Grade Is D or F
Severe bufferbloat requires a two-phase response:
Phase 1 — Immediate interim mitigation. Place the recognition display on a QoS priority queue at the access switch so its traffic is served before bulk student traffic in the uplink queue. This does not fix bufferbloat for the school network overall, but it ensures the display’s video and CMS traffic is not waiting behind the bulk queue during peak hours. Schools that manage athletic recognition programs and events that run on tight schedules benefit from this interim step during high-traffic periods like award ceremonies or back-to-school nights.
Phase 2 — Structural remediation. Enable AQM on the edge router. If the edge router does not support AQM (common on ISP-provided cable or DSL equipment), request that the ISP enable it on the modem, or replace the edge router with one that does. Schools with very high student device counts that consistently saturate a cable or DSL uplink may also need to upgrade their internet connection tier — AQM cannot create capacity that does not exist, it can only ensure that available capacity is allocated fairly and with minimal queuing delay.
Planning a recognition display installation and want to confirm the network path — including bufferbloat baseline, QoS requirements, and uplink specifications — before the display is commissioned? Rocket Alumni Solutions provides network readiness documentation for hall-of-fame kiosks, athletic record boards, and donor recognition displays, including traffic baselines, CMS bandwidth requirements, and switch configuration guidance for school IT teams. Request a network-readiness demo to see how Rocket Alumni Solutions supports school IT from planning through year-round operation.
Resolving bufferbloat at the edge router transforms a sluggish recognition kiosk into a responsive experience without replacing any display hardware or changing the CMS configuration
Bufferbloat-Specific Considerations for Recognition Display Video
Short-Form Video Highlight Clips
Athletic highlight video — game-winning moments, championship celebrations, senior-night captures — is the most demanding content type for a bufferbloated network path. Video players use HTTP Adaptive Bitrate (ABR) streaming: they request the highest quality bitrate the network can deliver and step down to lower quality when bandwidth is insufficient.
On a bufferbloated network, ABR behaves unpredictably. The measured throughput appears adequate during idle periods, so the player requests a high-bitrate segment. When load appears and latency spikes, the segment transfer stalls mid-download. The player drops to a lower bitrate and requests a replacement segment — which also stalls. The result is visible buffering, quality oscillation, and eventually a timeout that causes the player to display an error or fall back to a static image.
Schools that display athletic archive footage — including historic game film converted from older media formats for recognition program use — should test bufferbloat specifically with video content playing rather than relying solely on synthetic traffic measurements. Real video traffic has different burst characteristics than the test tool’s TCP streams and may trigger bufferbloat differently.
Touchscreen Interaction Latency
A hall-of-fame kiosk that stores athlete profiles, baseball position histories, and varsity letter award records for a searchable interactive display sends a network request on each touch interaction when content is served dynamically from the CMS. The user touches a filter, the display sends a request, the CMS responds with the filtered record set, and the display renders the results.
On a well-managed network (grade A or B), this sequence completes in 80–150 ms — faster than a user perceives as a delay. On a grade D or F network during peak hours, the network portion alone may take 800–2000 ms, producing a visibly sluggish response that discourages continued interaction.
This is particularly impactful for programs that use recognition displays as a community engagement tool — visitors who touch the screen once and see a slow response rarely touch it again. The interactive value of the display is effectively lost during the bufferbloat window, even though the hardware and software are functioning correctly.
CMS Background Sync Traffic
Cloud CMS platforms maintain persistent connections to recognition displays and push content updates as they are published. This background sync traffic — typically HTTPS or WebSocket connections — competes with video and interactive content for the same congested uplink queue during peak hours.
On a bufferbloated network, background sync traffic can be particularly affected because TCP’s congestion avoidance algorithm interprets the high latency as a congestion signal and reduces the sending rate of the sync connection. A CMS that would otherwise push a new recognition profile in under 10 seconds may throttle itself to a trickle, taking minutes to complete the same transfer.
Programs that rely on real-time updates — publishing a new inductee announcement during a recognition ceremony, updating an employee recognition program display between sessions at a school event — may find that their CMS updates do not appear on screen when expected, creating an awkward gap between the published announcement and the visible display.
Combining Bufferbloat Testing With Other Network Checks
The bufferbloat test is most useful when combined with the other Layer 2 and Layer 3 checks that form a complete recognition display pre-commissioning validation. Bufferbloat is a Layer 4 phenomenon (TCP queuing behavior) that operates above the switch-level concerns addressed by STP, VLAN, DHCP, and UDLD tests — but all of these checks serve the same goal: confirming that the network path reliably delivers low-latency, high-availability connectivity to the display.
A display that passes all Layer 2 checks — correct VLAN, PortFast on the access port, UDLD on fiber uplinks, DHCP Option 82 compatibility — but fails the bufferbloat test is experiencing a problem at the network edge, not at the access switch. The Layer 2 infrastructure is correctly configured; the issue is that the correctly delivered packets are sitting in a congested queue at the edge router before reaching the internet. The fix is at the edge, not at the switch.
Schools that maintain digital trophy case software with athlete profiles, championship banners, and award databases should include a periodic bufferbloat re-test in their annual network validation schedule — not just at initial commissioning. School networks grow as device counts increase, and a connection that showed a grade A result when the display was installed may show grade C or D three years later as the student population and device count have grown.
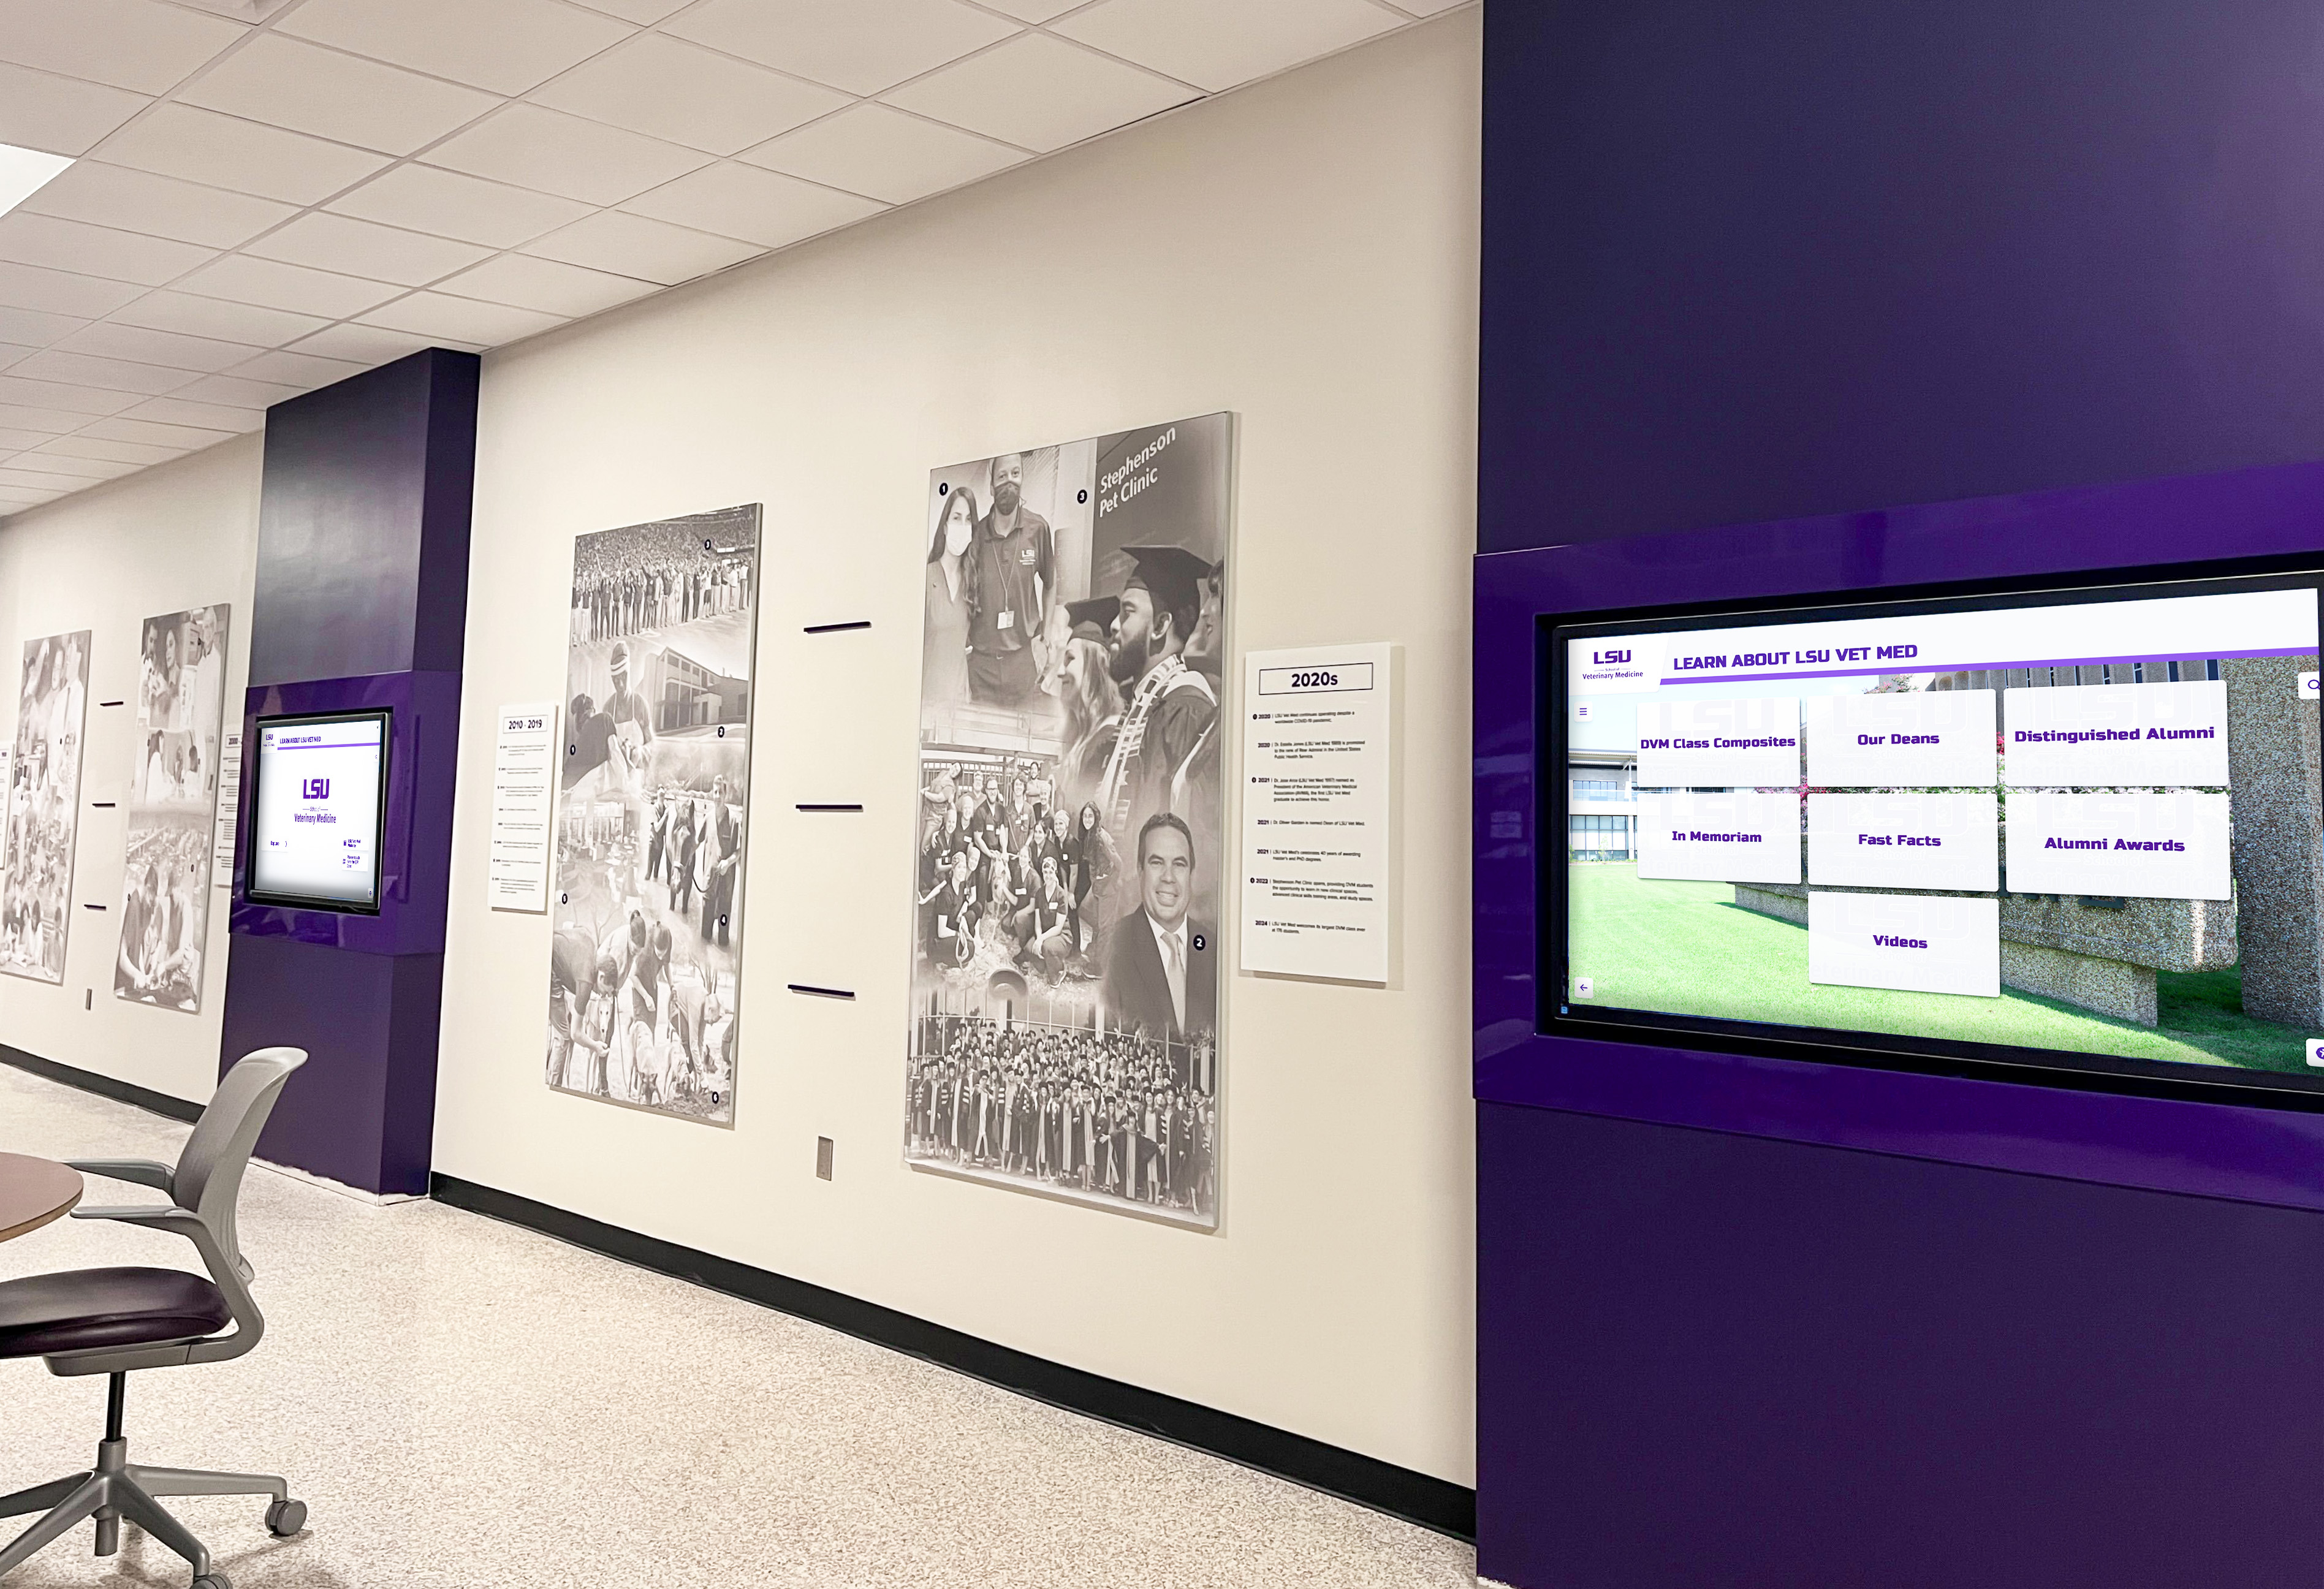
Multi-display installations aggregate CMS traffic — a bufferbloat baseline measured for one display may under-represent the impact when five displays are simultaneously syncing content at the start of the school day
When to Re-Run the Bufferbloat Test
Run a fresh bufferbloat test in any of these scenarios:
- After an uplink upgrade — confirm that the new connection is performing to specification and that the ISP’s equipment is not reintroducing bufferbloat at a higher throughput
- After an edge router replacement — verify that AQM is enabled and configured correctly on the new device
- At the start of each academic year — student device count typically increases in September; re-establishing the peak-hour baseline confirms the network still performs to the required standard
- When users report new display performance issues — a bufferbloat test is a two-minute diagnostic that either confirms or rules out the network path as the cause of the reported symptom
- After school network expansion — adding buildings, switches, or VLANs can change the routing path for display traffic in ways that introduce new bufferbloat sources
Athletic directors and program coordinators who manage recognition ceremonies, sports playoffs, and athletic events on tight schedules should communicate any planned public-facing display events to IT so a bufferbloat check can be run the day before, while there is still time to implement a QoS policy or contact the ISP if results are unacceptable.
FAQ: Bufferbloat and Recognition Display Video
Does a fast speed test mean there is no bufferbloat?
No. A speed test measures throughput — how many megabits per second the connection can deliver — without measuring latency under load. A connection can show 500 Mbps download while still producing 400 ms of added latency under load due to bufferbloat. Speed and latency are independent measurements. A bufferbloat speed test — one that specifically measures latency while generating simultaneous load — is the correct tool. A standard throughput-only speed test will not detect bufferbloat even when it is severe.
Can bufferbloat affect a recognition display connected by Wi-Fi differently than one connected by Ethernet?
Yes. Wi-Fi adds its own latency and introduces additional buffering at the wireless access point. A Wi-Fi-connected recognition display typically shows higher idle latency than an Ethernet-connected display, and the bufferbloat grade may reflect both the uplink router’s buffer behavior and the wireless AP’s queue behavior combined. For recognition displays in a fixed, accessible location, Ethernet is strongly preferred over Wi-Fi — it eliminates the wireless AP as a bufferbloat source and provides consistent, measurable baseline latency. If Wi-Fi is the only option, test from both the wireless access point’s wired uplink (if accessible) and from the display itself to isolate whether the bufferbloat is at the AP or the edge router.
Will enabling FQ-CoDel on the edge router reduce internet speed for other school users?
No. FQ-CoDel manages the queue more intelligently but does not reduce available bandwidth. It schedules packets so that no single flow fills the queue at the expense of others — the result is that every user’s connection, including the recognition display’s, experiences lower latency under load. Total throughput on the link remains the same or slightly higher because TCP connections with lower RTT can use available bandwidth more efficiently. The only scenario where AQM appears to “reduce” speed is when a throughput-only speed test runs after AQM is enabled — the test may show slightly lower peak throughput because AQM limits the queue depth that a single flow can monopolize. In practice, this throughput difference is not noticeable under normal conditions.
Can a recognition display cause bufferbloat for other school devices?
Yes, but it is uncommon. A recognition display that is actively downloading a large content library update — during initial setup or a major CMS platform migration — can generate enough traffic to contribute to uplink congestion. Under normal operating conditions, recognition display CMS sync traffic is modest: a few hundred kilobits per second for record updates, up to a few megabits per second during video transfers. This traffic is unlikely to cause measurable bufferbloat on its own. If the display is receiving a large initial content migration (gigabytes of historical images and video), schedule that transfer during off-hours to avoid contributing to peak-hour congestion.
How does bufferbloat interact with an athletic awards database or a recognition archive with large image libraries?
When a recognition display with a large local cache — including athletic awards database records with multiple seasons of photos and document attachments — synchronizes with the CMS after an extended offline period, the re-sync involves a larger data transfer than the typical incremental update. Under bufferbloat conditions, this re-sync may stall repeatedly as TCP congestion avoidance throttles the connection. The practical effect is that a display returning from a weekend or holiday shutdown with bufferbloat on the path may take significantly longer to reach current content than the CMS platform’s stated sync time — not because the CMS is slow, but because the TCP connection is being throttled by queuing delays at the edge router. Resolving bufferbloat reduces re-sync time to its expected value.
Should the bufferbloat test be run from the display itself or from a separate laptop?
Run it from the recognition display’s own media PC. The bufferbloat test must traverse the exact network path that the display uses in production — the same physical port, VLAN, uplink chain, and edge router. A laptop connected to a different port or VLAN may traverse a different uplink path and produce results that do not represent the display’s actual network conditions. The only scenario where testing from a separate device is useful is when comparing the display’s path to a reference path — for example, confirming that a priority QoS queue is correctly reducing loaded latency for display traffic relative to a baseline device on the general student VLAN.
What if the school’s edge router does not support AQM?
Several options apply in order of preference:
- Replace the edge router with a model that supports FQ-CoDel or CAKE — pfSense/OPNsense on commodity hardware, a supported commercial firewall, or a newer ISP-provided modem if the ISP offers one.
- Request ISP-side AQM — some ISPs can enable AQM at the DSLAM or CMTS, reducing bufferbloat before traffic reaches the school’s equipment. Results vary by ISP and connection type.
- Apply traffic shaping at the access switch — set the uplink rate on the access switch’s uplink port to 90% of the measured line rate. This keeps the edge router’s queue from filling completely but is a rough substitute for true AQM.
- Apply QoS prioritization on the display port — this does not reduce bufferbloat for the school network overall, but it ensures the display’s traffic is queued ahead of bulk traffic, reducing the display’s observed loaded latency relative to other flows.
Schools planning to honor coaches, athletic staff, and program contributors through recognition display programs should factor network quality improvement into the recognition program’s implementation timeline — a display that runs on a well-managed network delivers a reliably impressive experience, while one hampered by bufferbloat undermines the program’s impact regardless of content quality.
Ready to commission a recognition display that delivers reliable video and responsive touch on your school’s network? Rocket Alumni Solutions deploys hall-of-fame kiosks, athletic record boards, and donor recognition displays for schools with complete network requirements documentation — including bandwidth baselines, CMS traffic profiles, and QoS configuration guidance — so your IT team can validate the network path before the display enters unattended operation. Schedule a demo to see how Rocket Alumni Solutions supports school IT teams and recognition program coordinators from initial installation through ongoing content management.